- Volumes 84-95 (2024)
-
Volumes 72-83 (2023)
-
Volume 83
Pages 1-258 (December 2023)
-
Volume 82
Pages 1-204 (November 2023)
-
Volume 81
Pages 1-188 (October 2023)
-
Volume 80
Pages 1-202 (September 2023)
-
Volume 79
Pages 1-172 (August 2023)
-
Volume 78
Pages 1-146 (July 2023)
-
Volume 77
Pages 1-152 (June 2023)
-
Volume 76
Pages 1-176 (May 2023)
-
Volume 75
Pages 1-228 (April 2023)
-
Volume 74
Pages 1-200 (March 2023)
-
Volume 73
Pages 1-138 (February 2023)
-
Volume 72
Pages 1-144 (January 2023)
-
Volume 83
-
Volumes 60-71 (2022)
-
Volume 71
Pages 1-108 (December 2022)
-
Volume 70
Pages 1-106 (November 2022)
-
Volume 69
Pages 1-122 (October 2022)
-
Volume 68
Pages 1-124 (September 2022)
-
Volume 67
Pages 1-102 (August 2022)
-
Volume 66
Pages 1-112 (July 2022)
-
Volume 65
Pages 1-138 (June 2022)
-
Volume 64
Pages 1-186 (May 2022)
-
Volume 63
Pages 1-124 (April 2022)
-
Volume 62
Pages 1-104 (March 2022)
-
Volume 61
Pages 1-120 (February 2022)
-
Volume 60
Pages 1-124 (January 2022)
-
Volume 71
- Volumes 54-59 (2021)
- Volumes 48-53 (2020)
- Volumes 42-47 (2019)
- Volumes 36-41 (2018)
- Volumes 30-35 (2017)
- Volumes 24-29 (2016)
- Volumes 18-23 (2015)
- Volumes 12-17 (2014)
- Volume 11 (2013)
- Volume 10 (2012)
- Volume 9 (2011)
- Volume 8 (2010)
- Volume 7 (2009)
- Volume 6 (2008)
- Volume 5 (2007)
- Volume 4 (2006)
- Volume 3 (2005)
- Volume 2 (2004)
- Volume 1 (2003)
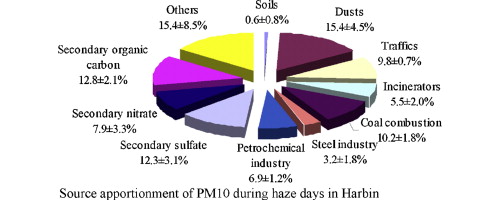
This study investigates the correlation between PM10 and meteorological factors such as wind speed, atmospheric visibility, dew point, relative humidity, and ambient temperature during a brown haze episode. In order to identify the potential sources of PM10 during brown haze episode, respirable particulate matter (PM10) was collected during both non-haze days and haze days and further analyzed for metallic elements, ionic species, and carbonaceous contents. Among them, ionic species contributed 45–64% to PM10, while metallic elements contributed 7–21% to PM10 which was smaller than the other chemical constituents. The average OC/EC ratio (42) in haze days was about three times of the average OC/EC ratio (14) in non-haze days. By using chemical mass balance (CMB) receptor model, the major sources were apportioned, including traffics, incinerators, coal combustion, steel industry, petrochemical industry, and secondary aerosols, etc. The contribution to PM10 concentration of each source was calculated for all the samples collected. The results showed that coal combustion was the major source of PM10 in non-haze days and secondary aerosols were the major source in haze days, followed by petrochemical industry, incinerators, and traffics, while other sources had negligible effect.

