- Volumes 84-95 (2024)
-
Volumes 72-83 (2023)
-
Volume 83
Pages 1-258 (December 2023)
-
Volume 82
Pages 1-204 (November 2023)
-
Volume 81
Pages 1-188 (October 2023)
-
Volume 80
Pages 1-202 (September 2023)
-
Volume 79
Pages 1-172 (August 2023)
-
Volume 78
Pages 1-146 (July 2023)
-
Volume 77
Pages 1-152 (June 2023)
-
Volume 76
Pages 1-176 (May 2023)
-
Volume 75
Pages 1-228 (April 2023)
-
Volume 74
Pages 1-200 (March 2023)
-
Volume 73
Pages 1-138 (February 2023)
-
Volume 72
Pages 1-144 (January 2023)
-
Volume 83
-
Volumes 60-71 (2022)
-
Volume 71
Pages 1-108 (December 2022)
-
Volume 70
Pages 1-106 (November 2022)
-
Volume 69
Pages 1-122 (October 2022)
-
Volume 68
Pages 1-124 (September 2022)
-
Volume 67
Pages 1-102 (August 2022)
-
Volume 66
Pages 1-112 (July 2022)
-
Volume 65
Pages 1-138 (June 2022)
-
Volume 64
Pages 1-186 (May 2022)
-
Volume 63
Pages 1-124 (April 2022)
-
Volume 62
Pages 1-104 (March 2022)
-
Volume 61
Pages 1-120 (February 2022)
-
Volume 60
Pages 1-124 (January 2022)
-
Volume 71
- Volumes 54-59 (2021)
- Volumes 48-53 (2020)
- Volumes 42-47 (2019)
- Volumes 36-41 (2018)
- Volumes 30-35 (2017)
- Volumes 24-29 (2016)
- Volumes 18-23 (2015)
- Volumes 12-17 (2014)
- Volume 11 (2013)
- Volume 10 (2012)
- Volume 9 (2011)
- Volume 8 (2010)
- Volume 7 (2009)
- Volume 6 (2008)
- Volume 5 (2007)
- Volume 4 (2006)
- Volume 3 (2005)
- Volume 2 (2004)
- Volume 1 (2003)
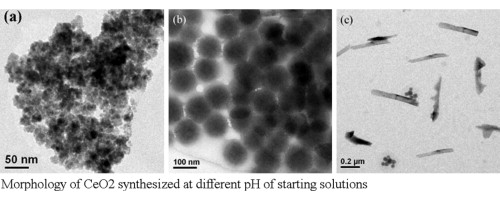
CeO2 nanocrystals with different morphologies were synthesized by adjusting the pH value of the starting solution in water-in-oil microemulsion. The obtained samples were characterized by transmission electron microscopy (TEM), X-ray diffraction (XRD), thermogravimetric analysis and different thermal analysis (TGA/DTA), Brunauer–Emmet–Teller (BET) surface area measurement, ultraviolet–visible absorption (UV–vis) spectroscopy and photoluminescence (PL) spectroscopy. Results show that the morphologies of CeO2 were transformed from granular to spherical and to rod-like while the pH of the starting solution varied from 5 to 8 and to 11. All samples were indexed to the phase of CeO2 and Ce(OH)4, and the molar ratio of CeO2 to Ce(OH)4 was deduced to be about 0.25. The morphologies of CeO2 nanocrystals had but slight influence on their specific surface areas, UV–vis spectra and PL spectra. The band gap energies of different morphological samples were estimated by UV–vis spectroscopic method.

