- Volumes 84-95 (2024)
-
Volumes 72-83 (2023)
-
Volume 83
Pages 1-258 (December 2023)
-
Volume 82
Pages 1-204 (November 2023)
-
Volume 81
Pages 1-188 (October 2023)
-
Volume 80
Pages 1-202 (September 2023)
-
Volume 79
Pages 1-172 (August 2023)
-
Volume 78
Pages 1-146 (July 2023)
-
Volume 77
Pages 1-152 (June 2023)
-
Volume 76
Pages 1-176 (May 2023)
-
Volume 75
Pages 1-228 (April 2023)
-
Volume 74
Pages 1-200 (March 2023)
-
Volume 73
Pages 1-138 (February 2023)
-
Volume 72
Pages 1-144 (January 2023)
-
Volume 83
-
Volumes 60-71 (2022)
-
Volume 71
Pages 1-108 (December 2022)
-
Volume 70
Pages 1-106 (November 2022)
-
Volume 69
Pages 1-122 (October 2022)
-
Volume 68
Pages 1-124 (September 2022)
-
Volume 67
Pages 1-102 (August 2022)
-
Volume 66
Pages 1-112 (July 2022)
-
Volume 65
Pages 1-138 (June 2022)
-
Volume 64
Pages 1-186 (May 2022)
-
Volume 63
Pages 1-124 (April 2022)
-
Volume 62
Pages 1-104 (March 2022)
-
Volume 61
Pages 1-120 (February 2022)
-
Volume 60
Pages 1-124 (January 2022)
-
Volume 71
- Volumes 54-59 (2021)
- Volumes 48-53 (2020)
- Volumes 42-47 (2019)
- Volumes 36-41 (2018)
- Volumes 30-35 (2017)
- Volumes 24-29 (2016)
- Volumes 18-23 (2015)
- Volumes 12-17 (2014)
- Volume 11 (2013)
- Volume 10 (2012)
- Volume 9 (2011)
- Volume 8 (2010)
- Volume 7 (2009)
- Volume 6 (2008)
- Volume 5 (2007)
- Volume 4 (2006)
- Volume 3 (2005)
- Volume 2 (2004)
- Volume 1 (2003)
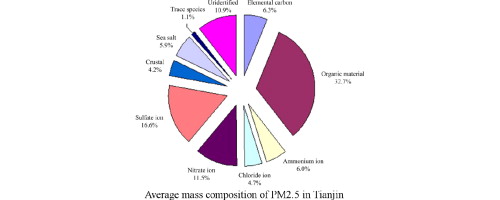
PM2.5 samples for 24 h were collected during winter in Tianjin, China. The ambient mass concentration and chemical composition of the PM2.5 were determined. Ionic species were analyzed by ion chromatography, while carbonaceous species were determined with the IMPROVE thermal optical reflectance (TOR) method, and inorganic elements were measured by inductively coupled plasma-atomic emission spectrometer. The daily PM2.5 mass concentrations ranged from 48.2 to 319.2 μg/m3 with an arithmetic average of 144.6 μg/m3. The elevated PM2.5 in winter was mostly attributed to combustion sources such as vehicle exhaust, heating, cooking and industrial emissions, low wind speeds and high relative humidity (RH), which were favorable for pollutant accumulation and formation of secondary pollutants. By chemical mass balance, it was estimated that about 89.1% of the PM2.5 mass concentrations were explained by carbonaceous species, secondary particles, crustal matters, sea salt and trace elements. Organic material was the largest contributor, accounting for about 32.7% of the total PM2.5 mass concentrations. SO42−, NO3−, Cl− and NH4+ were four major ions, accounting for 16.6%, 11.5%, 4.7% and 6.0%, respectively, of the total mass of PM2.5.

