- Volumes 84-95 (2024)
-
Volumes 72-83 (2023)
-
Volume 83
Pages 1-258 (December 2023)
-
Volume 82
Pages 1-204 (November 2023)
-
Volume 81
Pages 1-188 (October 2023)
-
Volume 80
Pages 1-202 (September 2023)
-
Volume 79
Pages 1-172 (August 2023)
-
Volume 78
Pages 1-146 (July 2023)
-
Volume 77
Pages 1-152 (June 2023)
-
Volume 76
Pages 1-176 (May 2023)
-
Volume 75
Pages 1-228 (April 2023)
-
Volume 74
Pages 1-200 (March 2023)
-
Volume 73
Pages 1-138 (February 2023)
-
Volume 72
Pages 1-144 (January 2023)
-
Volume 83
-
Volumes 60-71 (2022)
-
Volume 71
Pages 1-108 (December 2022)
-
Volume 70
Pages 1-106 (November 2022)
-
Volume 69
Pages 1-122 (October 2022)
-
Volume 68
Pages 1-124 (September 2022)
-
Volume 67
Pages 1-102 (August 2022)
-
Volume 66
Pages 1-112 (July 2022)
-
Volume 65
Pages 1-138 (June 2022)
-
Volume 64
Pages 1-186 (May 2022)
-
Volume 63
Pages 1-124 (April 2022)
-
Volume 62
Pages 1-104 (March 2022)
-
Volume 61
Pages 1-120 (February 2022)
-
Volume 60
Pages 1-124 (January 2022)
-
Volume 71
- Volumes 54-59 (2021)
- Volumes 48-53 (2020)
- Volumes 42-47 (2019)
- Volumes 36-41 (2018)
- Volumes 30-35 (2017)
- Volumes 24-29 (2016)
- Volumes 18-23 (2015)
- Volumes 12-17 (2014)
- Volume 11 (2013)
- Volume 10 (2012)
- Volume 9 (2011)
- Volume 8 (2010)
- Volume 7 (2009)
- Volume 6 (2008)
- Volume 5 (2007)
- Volume 4 (2006)
- Volume 3 (2005)
- Volume 2 (2004)
- Volume 1 (2003)
► PAHs in the stack flue gas are dominated in the gas phase.
► Nap, AcPy, Flu, PA and AnT are the most abundant PAHs in coking process.
► PAH pollution from coal charging stage is most serious in coking process.
► PAH emission factors are estimated for charging coal and pushing coke stages.
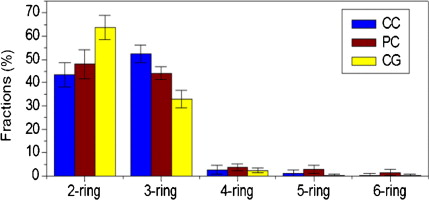
This study set out to assess the characteristics of polycyclic aromatic hydrocarbon (PAH) emission from coking industries, with field samplings conducted at four typical coke plants. For each selected plant, stack flue gas samples were collected during processes that included charging coal into the ovens (CC), pushing coke (PC) and the combustion of coke-oven gas (CG). Sixteen individual PAHs on the US EPA priority list were analyzed by gas chromatography/mass spectrometry (GC/MS). Results showed that the total PAH concentrations in the flue gas ranged from 45.776 to 414.874 μg/m3, with the highest emission level for CC (359.545 μg/m3). The concentration of PAH emitted from the CC process in CP1 (stamp charging) was lower than that from CP3 and CP4 (top charging). Low-molecular-weight PAHs (i.e., two- to three-ring PAHs) were predominant contributors to the total PAH contents, and Nap, AcPy, Flu, PhA, and AnT were found to be the most abundant ones. Total BaPeq concentrations for CC (2.248 μg/m3) were higher than those for PC (1.838 μg/m3) and CG (1.082 μg/m3), and DbA was an important contributor to carcinogenic risk as BaP in emissions from coking processes. Particulate PAH accounted for more than 20% of the total BaPeq concentrations, which were significantly higher than the corresponding contributions to the total PAH mass concentration (5%). Both particulate and gaseous PAH should be taken into consideration when the potential toxicity risk of PAH pollution during coking processes is assessed. The mean total-PAH emission factors were 346.132 and 93.173 μg/kg for CC and PC, respectively.

