- Volumes 84-95 (2024)
-
Volumes 72-83 (2023)
-
Volume 83
Pages 1-258 (December 2023)
-
Volume 82
Pages 1-204 (November 2023)
-
Volume 81
Pages 1-188 (October 2023)
-
Volume 80
Pages 1-202 (September 2023)
-
Volume 79
Pages 1-172 (August 2023)
-
Volume 78
Pages 1-146 (July 2023)
-
Volume 77
Pages 1-152 (June 2023)
-
Volume 76
Pages 1-176 (May 2023)
-
Volume 75
Pages 1-228 (April 2023)
-
Volume 74
Pages 1-200 (March 2023)
-
Volume 73
Pages 1-138 (February 2023)
-
Volume 72
Pages 1-144 (January 2023)
-
Volume 83
-
Volumes 60-71 (2022)
-
Volume 71
Pages 1-108 (December 2022)
-
Volume 70
Pages 1-106 (November 2022)
-
Volume 69
Pages 1-122 (October 2022)
-
Volume 68
Pages 1-124 (September 2022)
-
Volume 67
Pages 1-102 (August 2022)
-
Volume 66
Pages 1-112 (July 2022)
-
Volume 65
Pages 1-138 (June 2022)
-
Volume 64
Pages 1-186 (May 2022)
-
Volume 63
Pages 1-124 (April 2022)
-
Volume 62
Pages 1-104 (March 2022)
-
Volume 61
Pages 1-120 (February 2022)
-
Volume 60
Pages 1-124 (January 2022)
-
Volume 71
- Volumes 54-59 (2021)
- Volumes 48-53 (2020)
- Volumes 42-47 (2019)
- Volumes 36-41 (2018)
- Volumes 30-35 (2017)
- Volumes 24-29 (2016)
- Volumes 18-23 (2015)
- Volumes 12-17 (2014)
- Volume 11 (2013)
- Volume 10 (2012)
- Volume 9 (2011)
- Volume 8 (2010)
- Volume 7 (2009)
- Volume 6 (2008)
- Volume 5 (2007)
- Volume 4 (2006)
- Volume 3 (2005)
- Volume 2 (2004)
- Volume 1 (2003)
► Pollution events had much higher PM2.5 mass than normal days.
► PM2.5 from haze and fireworks displays was acidic.
► Dust storms and biomass burning particles were alkaline.
► SO42−/K+ and TCA/SO42− ratios were the effective indicators for differentiating pollution events.
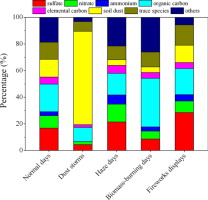
Daily fine particulate (PM2.5) samples were collected in Chengdu from April 2009 to February 2010 to investigate their chemical profiles during dust storms (DSs) and several types of pollution events, including haze (HDs), biomass burning (BBs), and fireworks displays (FDs). The highest PM2.5 mass concentrations were found during DSs (283.3 μg/m3), followed by FDs (212.7 μg/m3), HDs (187.3 μg/m3), and BBs (130.1 μg/m3). The concentrations of most elements were elevated during DSs and pollution events, except for BBs. Secondary inorganic ions (NO3−, SO42−, and NH4+) were enriched during HDs, while PM2.5 from BBs showed high K+ but low SO42−. FDs caused increases in K+ and enrichment in SO42−. Ca2+ was abundant in DS samples. Ion-balance calculations indicated that PM2.5 from HDs and FDs was more acidic than on normal days, but DS and BB particles were alkaline. The highest organic carbon (OC) concentration was 26.1 μg/m3 during FDs, followed by BBs (23.6 μg/m3), HDs (19.6 μg/m3), and DSs (18.8 μg/m3). In contrast, elemental carbon (EC) concentration was more abundant during HDs (10.6 μg/m3) and FDs (9.5 μg/m3) than during BBs (6.2 μg/m3) and DSs (6.0 μg/m3). The highest OC/EC ratios were obtained during BBs, with the lowest during HDs. SO42−/K+ and TCA/SO42− ratios proved to be effective indicators for differentiating pollution events. Mass balance showed that organic matter, SO42−, and NO3− were the dominant chemical components during pollution events, while soil dust was dominant during DSs.

