- Volumes 84-95 (2024)
-
Volumes 72-83 (2023)
-
Volume 83
Pages 1-258 (December 2023)
-
Volume 82
Pages 1-204 (November 2023)
-
Volume 81
Pages 1-188 (October 2023)
-
Volume 80
Pages 1-202 (September 2023)
-
Volume 79
Pages 1-172 (August 2023)
-
Volume 78
Pages 1-146 (July 2023)
-
Volume 77
Pages 1-152 (June 2023)
-
Volume 76
Pages 1-176 (May 2023)
-
Volume 75
Pages 1-228 (April 2023)
-
Volume 74
Pages 1-200 (March 2023)
-
Volume 73
Pages 1-138 (February 2023)
-
Volume 72
Pages 1-144 (January 2023)
-
Volume 83
-
Volumes 60-71 (2022)
-
Volume 71
Pages 1-108 (December 2022)
-
Volume 70
Pages 1-106 (November 2022)
-
Volume 69
Pages 1-122 (October 2022)
-
Volume 68
Pages 1-124 (September 2022)
-
Volume 67
Pages 1-102 (August 2022)
-
Volume 66
Pages 1-112 (July 2022)
-
Volume 65
Pages 1-138 (June 2022)
-
Volume 64
Pages 1-186 (May 2022)
-
Volume 63
Pages 1-124 (April 2022)
-
Volume 62
Pages 1-104 (March 2022)
-
Volume 61
Pages 1-120 (February 2022)
-
Volume 60
Pages 1-124 (January 2022)
-
Volume 71
- Volumes 54-59 (2021)
- Volumes 48-53 (2020)
- Volumes 42-47 (2019)
- Volumes 36-41 (2018)
- Volumes 30-35 (2017)
- Volumes 24-29 (2016)
- Volumes 18-23 (2015)
- Volumes 12-17 (2014)
- Volume 11 (2013)
- Volume 10 (2012)
- Volume 9 (2011)
- Volume 8 (2010)
- Volume 7 (2009)
- Volume 6 (2008)
- Volume 5 (2007)
- Volume 4 (2006)
- Volume 3 (2005)
- Volume 2 (2004)
- Volume 1 (2003)
► PM2.5 concentration and its ratio to PM10 in different weather systems in Hangzhou were studied.
► Nine weather systems were classified through 11-year weather charts from 1996 to 2006.
► The highest PM2.5 concentration coincided with large-scale continuous pollution events.
► Weather system forecast can be used as guidance on pollutants emission control.
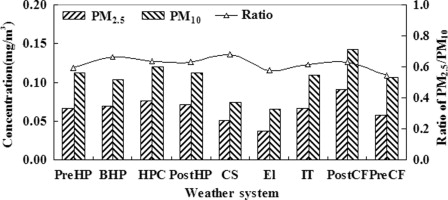
This observational study investigates the variation of PM2.5 concentration and its ratio against PM10 concentration under different weather systems and pollution types. The study was conducted in Hangzhou on east China's Yangtze River Delta using data collected at seven ambient air quality monitoring stations around the metropolitan area between 2006 and 2008 and using weather information in the same period. Nine predominant weather systems affecting the city were classified through careful analysis of the 11-year surface and upper air weather charts from 1996 to 2006. Each observational day was then assigned to one of the nine weather systems. It was found that the PM2.5 concentration varied greatly for different weather systems, with the highest PM2.5 concentration associated with the post-cold-frontal system at 0.091 mg/m3 and the lowest PM2.5 concentration with the easterlies system at 0.038 mg/m3, although the PM2.5/PM10 ratio remained consistently above 0.5 for all systems. The post-cold-frontal system typically occurs in autumn and winter while the easterlies system is more a summer phenomenon. Among all types of pollution, the highest PM2.5 concentration of 0.117 mg/m3 coincided with the large-scale continuous pollution events, suggesting that this type of pollution was more conducive to the formation of secondary particulate matters. The ratio of PM2.5/PM10 was above 0.5 in non-pollution days and all pollution types but one under the influence of dust storms when the ratio decreased to 0.3 or less. The outcomes of this study could be used to develop a rudimental predictive model of PM2.5 concentration based on weather system and pollution type.

