- Volumes 84-95 (2024)
-
Volumes 72-83 (2023)
-
Volume 83
Pages 1-258 (December 2023)
-
Volume 82
Pages 1-204 (November 2023)
-
Volume 81
Pages 1-188 (October 2023)
-
Volume 80
Pages 1-202 (September 2023)
-
Volume 79
Pages 1-172 (August 2023)
-
Volume 78
Pages 1-146 (July 2023)
-
Volume 77
Pages 1-152 (June 2023)
-
Volume 76
Pages 1-176 (May 2023)
-
Volume 75
Pages 1-228 (April 2023)
-
Volume 74
Pages 1-200 (March 2023)
-
Volume 73
Pages 1-138 (February 2023)
-
Volume 72
Pages 1-144 (January 2023)
-
Volume 83
-
Volumes 60-71 (2022)
-
Volume 71
Pages 1-108 (December 2022)
-
Volume 70
Pages 1-106 (November 2022)
-
Volume 69
Pages 1-122 (October 2022)
-
Volume 68
Pages 1-124 (September 2022)
-
Volume 67
Pages 1-102 (August 2022)
-
Volume 66
Pages 1-112 (July 2022)
-
Volume 65
Pages 1-138 (June 2022)
-
Volume 64
Pages 1-186 (May 2022)
-
Volume 63
Pages 1-124 (April 2022)
-
Volume 62
Pages 1-104 (March 2022)
-
Volume 61
Pages 1-120 (February 2022)
-
Volume 60
Pages 1-124 (January 2022)
-
Volume 71
- Volumes 54-59 (2021)
- Volumes 48-53 (2020)
- Volumes 42-47 (2019)
- Volumes 36-41 (2018)
- Volumes 30-35 (2017)
- Volumes 24-29 (2016)
- Volumes 18-23 (2015)
- Volumes 12-17 (2014)
- Volume 11 (2013)
- Volume 10 (2012)
- Volume 9 (2011)
- Volume 8 (2010)
- Volume 7 (2009)
- Volume 6 (2008)
- Volume 5 (2007)
- Volume 4 (2006)
- Volume 3 (2005)
- Volume 2 (2004)
- Volume 1 (2003)
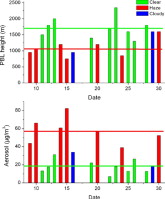
► Planetary boundary layer (PBL) heights were determined by three remote sensing instruments from September 9–30, 2010 at Tianjin, China.
► The averaged PBL height was about 1000–1300 m during noon/afternoon-time, and 200–300 m during night-time.
► PBL height and aerosol concentration were anti-correlated during clear and haze conditions. Feedback between PBL height and aerosol loading may exist.
A field experiment was conducted in Tianjin, China from September 9–30, 2010, focused on the evolution of Planetary Boundary Layer (PBL) and its impact on surface air pollutants. The experiment used three remote sensing instruments, wind profile radar (WPR), microwave radiometer (MWR) and micro-pulse lidar (MPL), to detect the vertical profiles of winds, temperature, and aerosol backscattering coefficient and to measure the vertical profiles of surface pollutants (aerosol, CO, SO2, NOx), and also collected sonic anemometers data from a 255-m meteorological tower. Based on these measurements, the evolution of the PBL was estimated. The averaged PBL height was about 1000–1300 m during noon/afternoon-time, and 200–300 m during night-time. The PBL height and the aerosol concentrations were anti-correlated during clear and haze conditions. The averaged maximum PBL heights were 1.08 and 1.70 km while the averaged aerosol concentrations were 52 and 17 μg/m3 under haze and clear sky conditions, respectively. The influence of aerosols and clouds on solar radiation was observed based on sonic anemometers data collected from the 255-m meteorological tower. The heat flux was found significantly decreased by haze (heavy pollution) or cloud, which tended to depress the development of PBL, while the repressed structure of PBL further weakened the diffusion of pollutants, leading to heavy pollution. This possible positive feedback cycle (more aerosols → lower PBL height → more aerosols) would induce an acceleration process for heavy ground pollution in megacities.

