- Volumes 84-95 (2024)
-
Volumes 72-83 (2023)
-
Volume 83
Pages 1-258 (December 2023)
-
Volume 82
Pages 1-204 (November 2023)
-
Volume 81
Pages 1-188 (October 2023)
-
Volume 80
Pages 1-202 (September 2023)
-
Volume 79
Pages 1-172 (August 2023)
-
Volume 78
Pages 1-146 (July 2023)
-
Volume 77
Pages 1-152 (June 2023)
-
Volume 76
Pages 1-176 (May 2023)
-
Volume 75
Pages 1-228 (April 2023)
-
Volume 74
Pages 1-200 (March 2023)
-
Volume 73
Pages 1-138 (February 2023)
-
Volume 72
Pages 1-144 (January 2023)
-
Volume 83
-
Volumes 60-71 (2022)
-
Volume 71
Pages 1-108 (December 2022)
-
Volume 70
Pages 1-106 (November 2022)
-
Volume 69
Pages 1-122 (October 2022)
-
Volume 68
Pages 1-124 (September 2022)
-
Volume 67
Pages 1-102 (August 2022)
-
Volume 66
Pages 1-112 (July 2022)
-
Volume 65
Pages 1-138 (June 2022)
-
Volume 64
Pages 1-186 (May 2022)
-
Volume 63
Pages 1-124 (April 2022)
-
Volume 62
Pages 1-104 (March 2022)
-
Volume 61
Pages 1-120 (February 2022)
-
Volume 60
Pages 1-124 (January 2022)
-
Volume 71
- Volumes 54-59 (2021)
- Volumes 48-53 (2020)
- Volumes 42-47 (2019)
- Volumes 36-41 (2018)
- Volumes 30-35 (2017)
- Volumes 24-29 (2016)
- Volumes 18-23 (2015)
- Volumes 12-17 (2014)
- Volume 11 (2013)
- Volume 10 (2012)
- Volume 9 (2011)
- Volume 8 (2010)
- Volume 7 (2009)
- Volume 6 (2008)
- Volume 5 (2007)
- Volume 4 (2006)
- Volume 3 (2005)
- Volume 2 (2004)
- Volume 1 (2003)
• PM2.5 concentrations of 10 cities in the cluster were measured simultaneously.
• Local and regional influences were studied.
• Spatial characteristics of PM2.5 concentrations were determined by hierarchical cluster analysis.
• Cities controlled by similar meteorological factors have similar PM concentration variability.
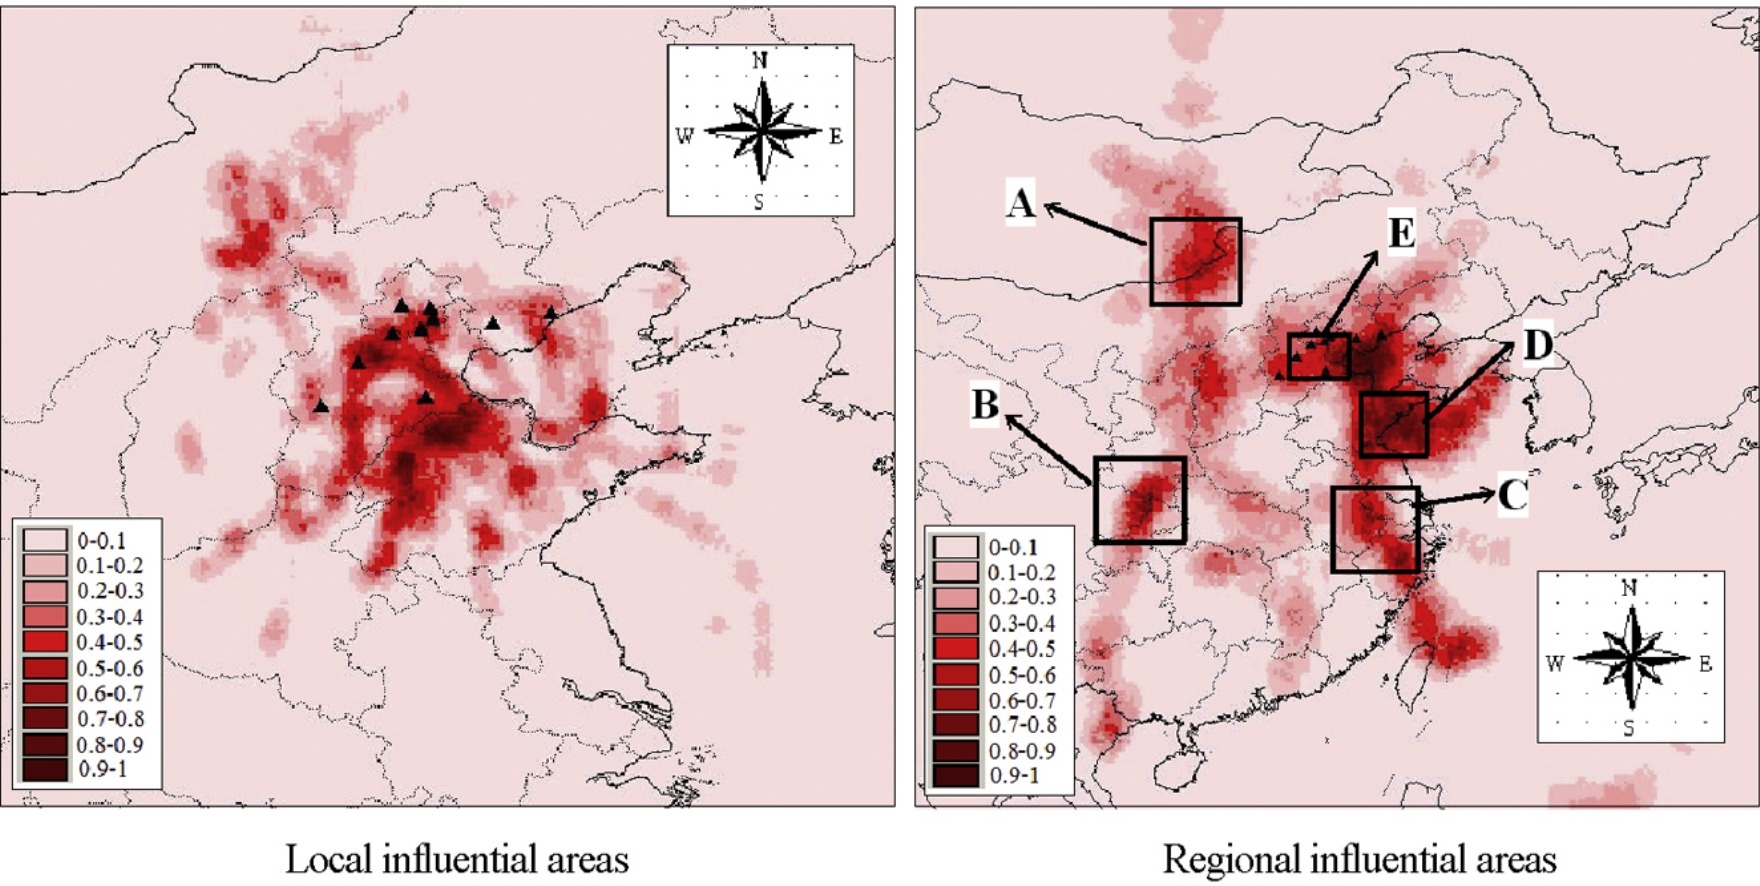
Hourly PM2.5 concentrations were observed simultaneously at a cities-cluster comprising 10 cities/towns in Hebei province in China from July 1 to 31, 2008. Among the 10 cities/towns, Baoding showed the highest average concentration level (161.57 μg/m3) and Yanjiao exhibited the lowest (99.35 μg/m3). These observed data were also studied using the joint potential source contribution function with 24-h and 72-h backward trajectories, to identify more clearly the local and countrywide-scale long-range transport sources. For the local sources, three important influential areas were found, whereas five important influential areas were defined for long-range transport sources. Spatial characteristics of PM2.5 were determined by multivariate statistical analyses. Soil dust, coal combustion, and vehicle emissions might be the potential contributors in these areas. The results of a hierarchical cluster analysis for back trajectory endpoints and PM2.5 concentrations datasets show that the spatial characteristics of PM2.5 in the cities-cluster were influenced not only by local sources, but also by long-range transport sources. Different cities in the cities-cluster obtained different weighted contributions from local or long-range transport sources. Cangzhou, Shijiazhuang, and Baoding are near the source areas in the south of Hebei province, whereas Zhuozhou, Yangfang, Yanjiao, Xianghe, and Langfang are close to the sources areas near Beijing and Tianjin.

Local influence; Regional influence; Joint potential source contribution function; Hierarchical cluster analysis
