- Volumes 84-95 (2024)
-
Volumes 72-83 (2023)
-
Volume 83
Pages 1-258 (December 2023)
-
Volume 82
Pages 1-204 (November 2023)
-
Volume 81
Pages 1-188 (October 2023)
-
Volume 80
Pages 1-202 (September 2023)
-
Volume 79
Pages 1-172 (August 2023)
-
Volume 78
Pages 1-146 (July 2023)
-
Volume 77
Pages 1-152 (June 2023)
-
Volume 76
Pages 1-176 (May 2023)
-
Volume 75
Pages 1-228 (April 2023)
-
Volume 74
Pages 1-200 (March 2023)
-
Volume 73
Pages 1-138 (February 2023)
-
Volume 72
Pages 1-144 (January 2023)
-
Volume 83
-
Volumes 60-71 (2022)
-
Volume 71
Pages 1-108 (December 2022)
-
Volume 70
Pages 1-106 (November 2022)
-
Volume 69
Pages 1-122 (October 2022)
-
Volume 68
Pages 1-124 (September 2022)
-
Volume 67
Pages 1-102 (August 2022)
-
Volume 66
Pages 1-112 (July 2022)
-
Volume 65
Pages 1-138 (June 2022)
-
Volume 64
Pages 1-186 (May 2022)
-
Volume 63
Pages 1-124 (April 2022)
-
Volume 62
Pages 1-104 (March 2022)
-
Volume 61
Pages 1-120 (February 2022)
-
Volume 60
Pages 1-124 (January 2022)
-
Volume 71
- Volumes 54-59 (2021)
- Volumes 48-53 (2020)
- Volumes 42-47 (2019)
- Volumes 36-41 (2018)
- Volumes 30-35 (2017)
- Volumes 24-29 (2016)
- Volumes 18-23 (2015)
- Volumes 12-17 (2014)
- Volume 11 (2013)
- Volume 10 (2012)
- Volume 9 (2011)
- Volume 8 (2010)
- Volume 7 (2009)
- Volume 6 (2008)
- Volume 5 (2007)
- Volume 4 (2006)
- Volume 3 (2005)
- Volume 2 (2004)
- Volume 1 (2003)
• PM2.5 and PM10 samples were collected simultaneously at a roadside site in Hong Kong.
• PM10-2.5 showed different chemical composition and potential sources from PM2.5.
• OC, EC, SO42−, NH4+, and K+ were more abundant in the fine fraction.
• Cl−, Al, Si, Ca, Ti, and Fe were enriched in the coarse fraction.
• Potential source apportionments were estimated for PM10-2.5.
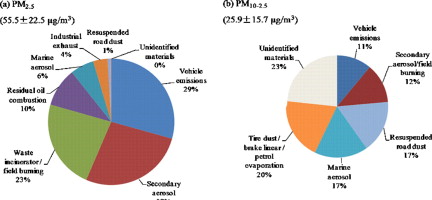
Twenty-four-hour PM2.5 and PM10 samples were collected simultaneously at a highly trafficked roadside site in Hong Kong every sixth day from October 2004 to September 2005. The mass concentrations of PM2.5, PM10-2.5 (defined as PM10 − PM2.5), organic carbon (OC), elemental carbon (EC), water-soluble ions, and up to 25 elements were determined. Investigation of the chemical compositions and potential sources revealed distinct differences between PM2.5 and PM10-2.5. The annual average mass concentrations were 55.5 ± 25.5 and 25.9 ± 15.7 μg/m3 for PM2.5 and PM10-2.5, respectively. EC, OM (OM = OC × 1.4), and ammonium sulfate comprised over ∼82% of PM2.5, accounting for ∼29%, ∼27%, and ∼25%, respectively, of the PM2.5 mass. Low OC/EC ratios (less than 1) for PM2.5 suggested that fresh diesel-engine exhaust was a major contributor. Seven sources were resolved for PM2.5 by positive matrix factorization (PMF) model, including vehicle emissions (∼29%), secondary inorganic aerosols (∼27%), waste incinerator/biomass burning (∼23%), residual oil combustion (∼10%), marine aerosols (∼6%), industrial exhaust (∼4%), and resuspended road dust (∼1%). EC and OM comprised only ∼19% of PM10-2.5. The average OC/EC ratio of PM10-2.5 was 7.8 ± 14.2, suggesting that sources other than vehicular exhaust were important contributors. The sources for PM10-2.5 determined by the PMF model included ∼20% traffic-generated resuspension (e.g., tire dust/brake linear/petrol evaporation), ∼17% locally resuspended road dust, ∼17% marine aerosols, ∼12% secondary aerosols/field burning, and ∼11% vehicle emissions.

