- Volumes 84-95 (2024)
-
Volumes 72-83 (2023)
-
Volume 83
Pages 1-258 (December 2023)
-
Volume 82
Pages 1-204 (November 2023)
-
Volume 81
Pages 1-188 (October 2023)
-
Volume 80
Pages 1-202 (September 2023)
-
Volume 79
Pages 1-172 (August 2023)
-
Volume 78
Pages 1-146 (July 2023)
-
Volume 77
Pages 1-152 (June 2023)
-
Volume 76
Pages 1-176 (May 2023)
-
Volume 75
Pages 1-228 (April 2023)
-
Volume 74
Pages 1-200 (March 2023)
-
Volume 73
Pages 1-138 (February 2023)
-
Volume 72
Pages 1-144 (January 2023)
-
Volume 83
-
Volumes 60-71 (2022)
-
Volume 71
Pages 1-108 (December 2022)
-
Volume 70
Pages 1-106 (November 2022)
-
Volume 69
Pages 1-122 (October 2022)
-
Volume 68
Pages 1-124 (September 2022)
-
Volume 67
Pages 1-102 (August 2022)
-
Volume 66
Pages 1-112 (July 2022)
-
Volume 65
Pages 1-138 (June 2022)
-
Volume 64
Pages 1-186 (May 2022)
-
Volume 63
Pages 1-124 (April 2022)
-
Volume 62
Pages 1-104 (March 2022)
-
Volume 61
Pages 1-120 (February 2022)
-
Volume 60
Pages 1-124 (January 2022)
-
Volume 71
- Volumes 54-59 (2021)
- Volumes 48-53 (2020)
- Volumes 42-47 (2019)
- Volumes 36-41 (2018)
- Volumes 30-35 (2017)
- Volumes 24-29 (2016)
- Volumes 18-23 (2015)
- Volumes 12-17 (2014)
- Volume 11 (2013)
- Volume 10 (2012)
- Volume 9 (2011)
- Volume 8 (2010)
- Volume 7 (2009)
- Volume 6 (2008)
- Volume 5 (2007)
- Volume 4 (2006)
- Volume 3 (2005)
- Volume 2 (2004)
- Volume 1 (2003)
• Concentrations of PM and gaseous pollutants in 31 Chinese cities (from 286 sites) were analyzed.
• Concentration levels of PMs were significantly different in various cities.
• The correlations between PMs and NO2, SO2 were moderate.
• The correlation between PMs and CO was instable and that between PMs and O3 was weak.
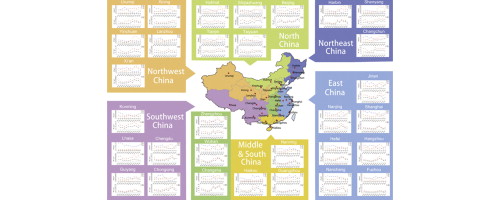
The variations of mass concentrations of PM2.5, PM10, SO2, NO2, CO, and O3 in 31 Chinese provincial capital cities were analyzed based on data from 286 monitoring sites obtained between March 22, 2013 and March 31, 2014. By comparing the pollutant concentrations over this length of time, the characteristics of the monthly variations of mass concentrations of air pollutants were determined. We used the Pearson correlation coefficient to establish the relationship between PM2.5, PM10, and the gas pollutants. The results revealed significant differences in the concentration levels of air pollutants and in the variations between the different cities. The Pearson correlation coefficients between PMs and NO2 and SO2 were either high or moderate (PM2.5 with NO2: r = 0.256–0.688, mean r = 0.498; PM10 with NO2: r = 0.169–0.713, mean r = 0.493; PM2.5 with SO2: r = 0.232–0.693, mean r = 0.449; PM10 with SO2: r = 0.131–0.669, mean r = 0.403). The correlation between PMs and CO was diverse (PM2.5: r = 0.156–0.721, mean r = 0.437; PM10: r = 0.06–0.67, mean r = 0.380). The correlation between PMs and O3 was either weak or uncorrelated (PM2.5: r = −0.35 to 0.089, mean r = −0.164; PM10: r = −0.279 to 0.078, mean r = −0.127), except in Haikou (PM2.5: r = 0.500; PM10: r = 0.509).

