- Volumes 84-95 (2024)
-
Volumes 72-83 (2023)
-
Volume 83
Pages 1-258 (December 2023)
-
Volume 82
Pages 1-204 (November 2023)
-
Volume 81
Pages 1-188 (October 2023)
-
Volume 80
Pages 1-202 (September 2023)
-
Volume 79
Pages 1-172 (August 2023)
-
Volume 78
Pages 1-146 (July 2023)
-
Volume 77
Pages 1-152 (June 2023)
-
Volume 76
Pages 1-176 (May 2023)
-
Volume 75
Pages 1-228 (April 2023)
-
Volume 74
Pages 1-200 (March 2023)
-
Volume 73
Pages 1-138 (February 2023)
-
Volume 72
Pages 1-144 (January 2023)
-
Volume 83
-
Volumes 60-71 (2022)
-
Volume 71
Pages 1-108 (December 2022)
-
Volume 70
Pages 1-106 (November 2022)
-
Volume 69
Pages 1-122 (October 2022)
-
Volume 68
Pages 1-124 (September 2022)
-
Volume 67
Pages 1-102 (August 2022)
-
Volume 66
Pages 1-112 (July 2022)
-
Volume 65
Pages 1-138 (June 2022)
-
Volume 64
Pages 1-186 (May 2022)
-
Volume 63
Pages 1-124 (April 2022)
-
Volume 62
Pages 1-104 (March 2022)
-
Volume 61
Pages 1-120 (February 2022)
-
Volume 60
Pages 1-124 (January 2022)
-
Volume 71
- Volumes 54-59 (2021)
- Volumes 48-53 (2020)
- Volumes 42-47 (2019)
- Volumes 36-41 (2018)
- Volumes 30-35 (2017)
- Volumes 24-29 (2016)
- Volumes 18-23 (2015)
- Volumes 12-17 (2014)
- Volume 11 (2013)
- Volume 10 (2012)
- Volume 9 (2011)
- Volume 8 (2010)
- Volume 7 (2009)
- Volume 6 (2008)
- Volume 5 (2007)
- Volume 4 (2006)
- Volume 3 (2005)
- Volume 2 (2004)
- Volume 1 (2003)
• Real-time measurements of PM2.5, PM10–2.5 and BC were conducted over 12 months in a street canyon.
• PM2.5 showed good correlations with traffic counts of private cars and double-deck buses.
• PM2.5 and BC show similar diurnal variations with diesel-fueled vehicles.
• PM10–2.5 showed good correlations with total traffic counts and wind speed during the test period.
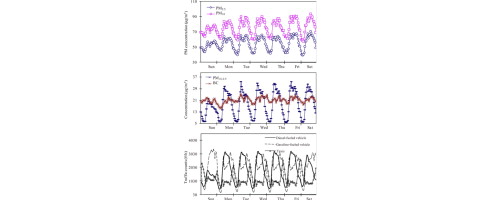
A continuous dichotomous beta gauge monitor was used to characterize the hourly content of PM2.5, PM10–2.5, and Black Carbon (BC) over a 12-month period in an urban street canyon of Hong Kong. Hourly vehicle counts for nine vehicle classes and meteorological data were also recorded. The average weekly cycles of PM2.5, PM10–2.5, and BC suggested that all species are related to traffic, with high concentrations on workdays and low concentrations over the weekends. PM2.5 exhibited two comparable concentrations at 10:00–11:00 (63.4 μg/m3) and 17:00–18:00 (65.0 μg/m3) local time (LT) during workdays, corresponding to the hours when the numbers of diesel-fueled and gasoline-fueled vehicles were at their maximum levels: 3179 and 2907 h−1, respectively. BC is emitted mainly by diesel-fueled vehicles and this showed the highest concentration (31.2 μg/m3) during the midday period (10:00–11:00 LT) on workdays. A poor correlation was found between PM2.5 concentration and wind speed (R = 0.51, P-value > 0.001). In contrast, the concentration of PM10–2.5 was found to depend upon wind speed and it increased with obvious statistical significance as wind speed increased (R = 0.98, P-value < 0.0001).

