- Volumes 84-95 (2024)
-
Volumes 72-83 (2023)
-
Volume 83
Pages 1-258 (December 2023)
-
Volume 82
Pages 1-204 (November 2023)
-
Volume 81
Pages 1-188 (October 2023)
-
Volume 80
Pages 1-202 (September 2023)
-
Volume 79
Pages 1-172 (August 2023)
-
Volume 78
Pages 1-146 (July 2023)
-
Volume 77
Pages 1-152 (June 2023)
-
Volume 76
Pages 1-176 (May 2023)
-
Volume 75
Pages 1-228 (April 2023)
-
Volume 74
Pages 1-200 (March 2023)
-
Volume 73
Pages 1-138 (February 2023)
-
Volume 72
Pages 1-144 (January 2023)
-
Volume 83
-
Volumes 60-71 (2022)
-
Volume 71
Pages 1-108 (December 2022)
-
Volume 70
Pages 1-106 (November 2022)
-
Volume 69
Pages 1-122 (October 2022)
-
Volume 68
Pages 1-124 (September 2022)
-
Volume 67
Pages 1-102 (August 2022)
-
Volume 66
Pages 1-112 (July 2022)
-
Volume 65
Pages 1-138 (June 2022)
-
Volume 64
Pages 1-186 (May 2022)
-
Volume 63
Pages 1-124 (April 2022)
-
Volume 62
Pages 1-104 (March 2022)
-
Volume 61
Pages 1-120 (February 2022)
-
Volume 60
Pages 1-124 (January 2022)
-
Volume 71
- Volumes 54-59 (2021)
- Volumes 48-53 (2020)
- Volumes 42-47 (2019)
- Volumes 36-41 (2018)
- Volumes 30-35 (2017)
- Volumes 24-29 (2016)
- Volumes 18-23 (2015)
- Volumes 12-17 (2014)
- Volume 11 (2013)
- Volume 10 (2012)
- Volume 9 (2011)
- Volume 8 (2010)
- Volume 7 (2009)
- Volume 6 (2008)
- Volume 5 (2007)
- Volume 4 (2006)
- Volume 3 (2005)
- Volume 2 (2004)
- Volume 1 (2003)
• Black carbon (BC) and meteorological data from Jan 2008 to Dec 2012 were measured in Shanghai.
• BC aerosol mass carried by winds of varying directions from non-local sources was estimated.
• Relationships between BC aerosols and wind speed were analyzed.
• Total BC mass contributed by non-local sources was 6404.05 t per year in Shanghai.
• BC mass transported into Shanghai in winter was about 35% of the whole year.
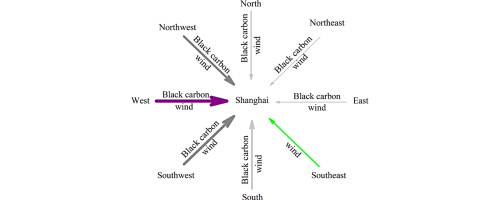
Black carbon (BC) aerosol mass carried by winds of varying directions from non-local sources was estimated based on hourly measured data of BC mass concentration (CBC) and meteorological parameters from January 2008 to December 2012 in Shanghai, and the relationship between annual average CBC and wind speed was analyzed. The results show that the annual average CBC decreased with wind speed for speeds exceeding 0.3 m/s. The relationship between the two was determined by a linear fit with correlation coefficient 0.88. Assuming BC aerosol mass of non-local sources transported by a southeast wind was zero, annual average BC concentrations (μg/m3) carried by winds of variable direction were 1.99 (southwest), 1.95 (west), 1.15 (northwest), 0.54 (south), 0.39 (north), 0.01 (northeast), and 0.01 (east). BC aerosol mass of non-local sources transported by wind to Shanghai was about 6404.05 t per year, among which the total contribution of southwest, west, and northwest winds was nearly 84%. The aerosol mass transported to Shanghai in winter accounted for 35% that of the entire year, and was greater than that of the other seasons.

