- Volumes 84-95 (2024)
-
Volumes 72-83 (2023)
-
Volume 83
Pages 1-258 (December 2023)
-
Volume 82
Pages 1-204 (November 2023)
-
Volume 81
Pages 1-188 (October 2023)
-
Volume 80
Pages 1-202 (September 2023)
-
Volume 79
Pages 1-172 (August 2023)
-
Volume 78
Pages 1-146 (July 2023)
-
Volume 77
Pages 1-152 (June 2023)
-
Volume 76
Pages 1-176 (May 2023)
-
Volume 75
Pages 1-228 (April 2023)
-
Volume 74
Pages 1-200 (March 2023)
-
Volume 73
Pages 1-138 (February 2023)
-
Volume 72
Pages 1-144 (January 2023)
-
Volume 83
-
Volumes 60-71 (2022)
-
Volume 71
Pages 1-108 (December 2022)
-
Volume 70
Pages 1-106 (November 2022)
-
Volume 69
Pages 1-122 (October 2022)
-
Volume 68
Pages 1-124 (September 2022)
-
Volume 67
Pages 1-102 (August 2022)
-
Volume 66
Pages 1-112 (July 2022)
-
Volume 65
Pages 1-138 (June 2022)
-
Volume 64
Pages 1-186 (May 2022)
-
Volume 63
Pages 1-124 (April 2022)
-
Volume 62
Pages 1-104 (March 2022)
-
Volume 61
Pages 1-120 (February 2022)
-
Volume 60
Pages 1-124 (January 2022)
-
Volume 71
- Volumes 54-59 (2021)
- Volumes 48-53 (2020)
- Volumes 42-47 (2019)
- Volumes 36-41 (2018)
- Volumes 30-35 (2017)
- Volumes 24-29 (2016)
- Volumes 18-23 (2015)
- Volumes 12-17 (2014)
- Volume 11 (2013)
- Volume 10 (2012)
- Volume 9 (2011)
- Volume 8 (2010)
- Volume 7 (2009)
- Volume 6 (2008)
- Volume 5 (2007)
- Volume 4 (2006)
- Volume 3 (2005)
- Volume 2 (2004)
- Volume 1 (2003)
• Climatologic anomaly was studied for persistent PM pollution events in Shanghai in December 2013.
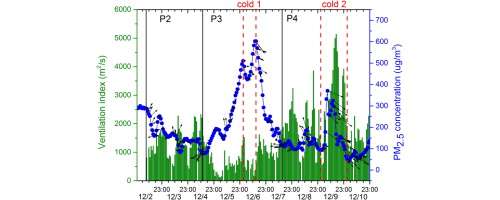
• High PM2.5 concentrations were closely associated with a low local ventilation index.
• Upstream aerosol transport by weak cold front attributed to the most severe PM2.5 pollution.
• Different cold fronts had different effects on local air quality.
A severe particulate matter pollution event occurred in Shanghai from 1 to 9 December 2013. The mean hourly mass concentrations of PM2.5 and PM10 were 211.9 and 249.0 μg/m3, respectively. Reanalysis data, in situ, and remote-sensing measurements were used to examine the impacts of meteorological conditions on this event. It was found that the synoptic pattern of weak pressure, the reduced planetary boundary layer height, and the passage of two cold fronts were key factors causing the event. Four stages were identified during this event based on the evolution of its PM2.5 levels and weather conditions. The highest concentration of PM2.5 (602 μg/m3) was observed in stage 3. High PM2.5 concentrations were closely associated with a low local ventilation index, with an average of 505 m2/s, as well as with the influx of pollutants from upstream, transported by the cold fronts.

