- Volumes 84-95 (2024)
-
Volumes 72-83 (2023)
-
Volume 83
Pages 1-258 (December 2023)
-
Volume 82
Pages 1-204 (November 2023)
-
Volume 81
Pages 1-188 (October 2023)
-
Volume 80
Pages 1-202 (September 2023)
-
Volume 79
Pages 1-172 (August 2023)
-
Volume 78
Pages 1-146 (July 2023)
-
Volume 77
Pages 1-152 (June 2023)
-
Volume 76
Pages 1-176 (May 2023)
-
Volume 75
Pages 1-228 (April 2023)
-
Volume 74
Pages 1-200 (March 2023)
-
Volume 73
Pages 1-138 (February 2023)
-
Volume 72
Pages 1-144 (January 2023)
-
Volume 83
-
Volumes 60-71 (2022)
-
Volume 71
Pages 1-108 (December 2022)
-
Volume 70
Pages 1-106 (November 2022)
-
Volume 69
Pages 1-122 (October 2022)
-
Volume 68
Pages 1-124 (September 2022)
-
Volume 67
Pages 1-102 (August 2022)
-
Volume 66
Pages 1-112 (July 2022)
-
Volume 65
Pages 1-138 (June 2022)
-
Volume 64
Pages 1-186 (May 2022)
-
Volume 63
Pages 1-124 (April 2022)
-
Volume 62
Pages 1-104 (March 2022)
-
Volume 61
Pages 1-120 (February 2022)
-
Volume 60
Pages 1-124 (January 2022)
-
Volume 71
- Volumes 54-59 (2021)
- Volumes 48-53 (2020)
- Volumes 42-47 (2019)
- Volumes 36-41 (2018)
- Volumes 30-35 (2017)
- Volumes 24-29 (2016)
- Volumes 18-23 (2015)
- Volumes 12-17 (2014)
- Volume 11 (2013)
- Volume 10 (2012)
- Volume 9 (2011)
- Volume 8 (2010)
- Volume 7 (2009)
- Volume 6 (2008)
- Volume 5 (2007)
- Volume 4 (2006)
- Volume 3 (2005)
- Volume 2 (2004)
- Volume 1 (2003)
• An aerosol pollution episode was analyzed to study the causes and variability of the heavy haze.
• Intensive in situ measurements were used in this study.
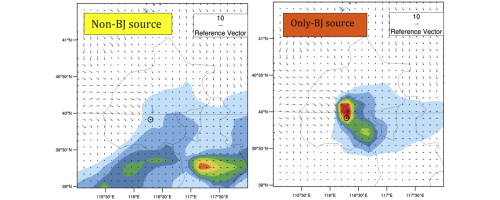
• WRF-Chem model was used to study contribution of local and regional emissions to the heavy haze.
• The weak wind and low PBL height played important roles for the formation of the heavy haze.
• During this episode, the local emission was the major cause for the formation of the heavy haze.
The causes and variability of a heavy haze episode in the Beijing region was analyzed. During the episode, the PM2.5 concentration reached a peak value of 450 μg/kg on January 18, 2013 and rapidly decreased to 100 μg/kg on January 19, 2013, characterizing a large variability in a very short period. This strong variability provides a good opportunity to study the causes of the haze formation. The in situ measurements (including surface meteorological data and vertical structures of the winds, temperature, humidity, and planetary boundary layer (PBL)) together with a chemical/dynamical regional model (WRF-Chem) were used for the analysis. In order to understand the rapid variability of the PM2.5 concentration in the episode, the correlation between the measured meteorological data (including wind speed, PBL height, relative humidity, etc.) and the measured particle concentration (PM2.5 concentration) was studied. In addition, two sensitive model experiments were performed to study the effect of individual contribution from local emissions and regional surrounding emissions to the heavy haze formation. The results suggest that there were two major meteorological factors in controlling the variability of the PM2.5 concentration, namely, surface wind speed and PBL height. During high wind periods, the horizontal transport of aerosol particles played an important role, and the heavy haze was formed when the wind speeds were very weak (less than 1 m/s). Under weak wind conditions, the horizontal transport of aerosol particles was also weak, and the vertical mixing of aerosol particles played an important role. As a result, the PBL height was a major factor in controlling the variability of the PM2.5 concentration. Under the shallow PBL height, aerosol particles were strongly confined near the surface, producing a high surface PM2.5 concentration. The sensitivity model study suggests that the local emissions (emissions from the Beijing region only) were the major cause for the heavy haze events. With only local emissions, the calculated peak value of the PM2.5 concentration was 350 μg/kg, which accounted for 78% of the measured peak value (450 μg/kg). In contrast, without the local emissions, the calculated peak value of the PM2.5 concentration was only 100 μg/kg, which accounted for 22% of the measured peak value.

