- Volumes 84-95 (2024)
-
Volumes 72-83 (2023)
-
Volume 83
Pages 1-258 (December 2023)
-
Volume 82
Pages 1-204 (November 2023)
-
Volume 81
Pages 1-188 (October 2023)
-
Volume 80
Pages 1-202 (September 2023)
-
Volume 79
Pages 1-172 (August 2023)
-
Volume 78
Pages 1-146 (July 2023)
-
Volume 77
Pages 1-152 (June 2023)
-
Volume 76
Pages 1-176 (May 2023)
-
Volume 75
Pages 1-228 (April 2023)
-
Volume 74
Pages 1-200 (March 2023)
-
Volume 73
Pages 1-138 (February 2023)
-
Volume 72
Pages 1-144 (January 2023)
-
Volume 83
-
Volumes 60-71 (2022)
-
Volume 71
Pages 1-108 (December 2022)
-
Volume 70
Pages 1-106 (November 2022)
-
Volume 69
Pages 1-122 (October 2022)
-
Volume 68
Pages 1-124 (September 2022)
-
Volume 67
Pages 1-102 (August 2022)
-
Volume 66
Pages 1-112 (July 2022)
-
Volume 65
Pages 1-138 (June 2022)
-
Volume 64
Pages 1-186 (May 2022)
-
Volume 63
Pages 1-124 (April 2022)
-
Volume 62
Pages 1-104 (March 2022)
-
Volume 61
Pages 1-120 (February 2022)
-
Volume 60
Pages 1-124 (January 2022)
-
Volume 71
- Volumes 54-59 (2021)
- Volumes 48-53 (2020)
- Volumes 42-47 (2019)
- Volumes 36-41 (2018)
- Volumes 30-35 (2017)
- Volumes 24-29 (2016)
- Volumes 18-23 (2015)
- Volumes 12-17 (2014)
- Volume 11 (2013)
- Volume 10 (2012)
- Volume 9 (2011)
- Volume 8 (2010)
- Volume 7 (2009)
- Volume 6 (2008)
- Volume 5 (2007)
- Volume 4 (2006)
- Volume 3 (2005)
- Volume 2 (2004)
- Volume 1 (2003)
• The over-standard situation of PM in surface layer of Guangzhou was analyzed.
• Vertical variations of mass concentrations of PM10, PM2.5 and PM1 in Guangzhou were investigated.
• Changes in the ratios of PM2.5/PM10 and PM1/PM2.5 were studied.
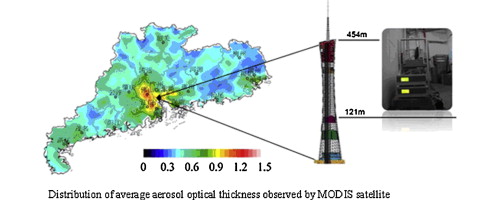
Measurements of particulate matter (PM), i.e., PM10, PM2.5, and PM1, have been performed on the Canton Tower, a landmark building in Guangzhou, at heights of 121 and 454 m since November 2010, using a GRIMM 180 aerosol particle spectrometer (Germany). Analyses of data from November 2010 to May 2013 showed that the annual average values of PM10, PM2.5, and PM1 at the observation height of 121 m above the ground were 44.1, 38.2, and 34.9 μg/m3, respectively, and those at 454 m above the ground were 35.7, 30.4, and 27.5 μg/m3, respectively. By considering the values of the secondary concentration limits given in the Ambient Air Quality Standards issued in 2012, it was observed that the annual average values of PM10 at the observation heights of 121 and 454 m, as well as those of PM2.5 at 454 m, reached those standards. Furthermore, the over-standard amplitude of the annual average value of PM2.5 at the observation height of 121 m was 9.1%. During the observation period, the maximum daily average values of PM10, PM2.5, and PM1 at the observation height of 121 m were 183.3, 144.8, and 123.8 μg/m3, respectively, and those at 454 m were 102.8, 92.7, and 86.4 μg/m3. The daily average values of PM10 at the observation height of 454 m were not above the standards. The over-standard frequencies of the daily average values of PM10 and PM2.5 at the observation height of 121 m were 0.6% and 10.7%, respectively, and the over-standard amplitudes were 9.0% and 24.4%, respectively. The over-standard frequency of the daily average value of PM2.5 at the observation height of 454 m was 2.0%, and the over-standard amplitude was 10.4%. Accordingly, it can be stated that the air at the observation height 454 m above the ground did not reach the secondary limit of the new standards. The pollution was most serious during winter, and the air was relatively cleaner during summer. Overall, the vertical distributions of PM10, PM2.5, and PM1 decreased with height. The lapse rates showed the following sequence: PM10 > PM2.5 > PM1, which indicates that the vertical distribution of fine particles is more uniform than that of coarse particles; the vertical distribution in summer is more uniform than in other seasons.

