- Volumes 84-95 (2024)
-
Volumes 72-83 (2023)
-
Volume 83
Pages 1-258 (December 2023)
-
Volume 82
Pages 1-204 (November 2023)
-
Volume 81
Pages 1-188 (October 2023)
-
Volume 80
Pages 1-202 (September 2023)
-
Volume 79
Pages 1-172 (August 2023)
-
Volume 78
Pages 1-146 (July 2023)
-
Volume 77
Pages 1-152 (June 2023)
-
Volume 76
Pages 1-176 (May 2023)
-
Volume 75
Pages 1-228 (April 2023)
-
Volume 74
Pages 1-200 (March 2023)
-
Volume 73
Pages 1-138 (February 2023)
-
Volume 72
Pages 1-144 (January 2023)
-
Volume 83
-
Volumes 60-71 (2022)
-
Volume 71
Pages 1-108 (December 2022)
-
Volume 70
Pages 1-106 (November 2022)
-
Volume 69
Pages 1-122 (October 2022)
-
Volume 68
Pages 1-124 (September 2022)
-
Volume 67
Pages 1-102 (August 2022)
-
Volume 66
Pages 1-112 (July 2022)
-
Volume 65
Pages 1-138 (June 2022)
-
Volume 64
Pages 1-186 (May 2022)
-
Volume 63
Pages 1-124 (April 2022)
-
Volume 62
Pages 1-104 (March 2022)
-
Volume 61
Pages 1-120 (February 2022)
-
Volume 60
Pages 1-124 (January 2022)
-
Volume 71
- Volumes 54-59 (2021)
- Volumes 48-53 (2020)
- Volumes 42-47 (2019)
- Volumes 36-41 (2018)
- Volumes 30-35 (2017)
- Volumes 24-29 (2016)
- Volumes 18-23 (2015)
- Volumes 12-17 (2014)
- Volume 11 (2013)
- Volume 10 (2012)
- Volume 9 (2011)
- Volume 8 (2010)
- Volume 7 (2009)
- Volume 6 (2008)
- Volume 5 (2007)
- Volume 4 (2006)
- Volume 3 (2005)
- Volume 2 (2004)
- Volume 1 (2003)
• Particle number concentration and size distribution during haze episodes in winter were analyzed.
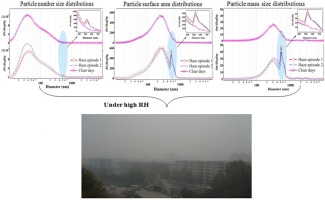
• Sharp increases in the 500–600 nm particle concentrations during haze episodes were observed.
• 500–600 nm particles were mainly formed via evaporation of droplets present in cloud and fog.
• New particle formation events were identified and studied on clear and haze days.
Number concentrations and distributions of 10–10,000 nm particles in a large city (Jinan) in the North China Plain were measured in winter 2009. The mean number concentrations of nucleation mode (10–20 nm), Aitken mode (20–100 nm), and accumulation mode (100–1000 nm) particles, as well as total particles were 925, 6898, 2476, and 10,299 cm−3, respectively. Two severe haze episodes, with elevated concentrations caused by pollutants accumulating, were observed. Accumulation mode particle concentrations were significantly higher during the episodes than on clear days, and nucleation mode particle concentrations were pronouncedly higher on clear days than during the episodes. The peaks of dominant number, surface area, and mass size distributions were around 30–50, 200–300, and 200–400 nm, respectively, both during the haze episodes and on clear days, but elevated mass and surface area concentrations around 500–600 nm were also observed during the haze episodes, suggesting these particles had significant contributions to haze formation. These particles were probably formed through larger droplets in cloud and fog evaporating. Two new particle formation events, probably triggered by strong photochemical processes on clear days and significant traffic emissions during haze episode 2, were found. Significant insights were made into haze formation in a polluted Chinese urban area.

