- Volumes 84-95 (2024)
-
Volumes 72-83 (2023)
-
Volume 83
Pages 1-258 (December 2023)
-
Volume 82
Pages 1-204 (November 2023)
-
Volume 81
Pages 1-188 (October 2023)
-
Volume 80
Pages 1-202 (September 2023)
-
Volume 79
Pages 1-172 (August 2023)
-
Volume 78
Pages 1-146 (July 2023)
-
Volume 77
Pages 1-152 (June 2023)
-
Volume 76
Pages 1-176 (May 2023)
-
Volume 75
Pages 1-228 (April 2023)
-
Volume 74
Pages 1-200 (March 2023)
-
Volume 73
Pages 1-138 (February 2023)
-
Volume 72
Pages 1-144 (January 2023)
-
Volume 83
-
Volumes 60-71 (2022)
-
Volume 71
Pages 1-108 (December 2022)
-
Volume 70
Pages 1-106 (November 2022)
-
Volume 69
Pages 1-122 (October 2022)
-
Volume 68
Pages 1-124 (September 2022)
-
Volume 67
Pages 1-102 (August 2022)
-
Volume 66
Pages 1-112 (July 2022)
-
Volume 65
Pages 1-138 (June 2022)
-
Volume 64
Pages 1-186 (May 2022)
-
Volume 63
Pages 1-124 (April 2022)
-
Volume 62
Pages 1-104 (March 2022)
-
Volume 61
Pages 1-120 (February 2022)
-
Volume 60
Pages 1-124 (January 2022)
-
Volume 71
- Volumes 54-59 (2021)
- Volumes 48-53 (2020)
- Volumes 42-47 (2019)
- Volumes 36-41 (2018)
- Volumes 30-35 (2017)
- Volumes 24-29 (2016)
- Volumes 18-23 (2015)
- Volumes 12-17 (2014)
- Volume 11 (2013)
- Volume 10 (2012)
- Volume 9 (2011)
- Volume 8 (2010)
- Volume 7 (2009)
- Volume 6 (2008)
- Volume 5 (2007)
- Volume 4 (2006)
- Volume 3 (2005)
- Volume 2 (2004)
- Volume 1 (2003)
• Local sources were drivers of severe air pollution events in winter.
• Road dust may be a significant source of particulate matter.
• O3 formation was governed by VOCs-limited conditions yielding a strong weekend effect.
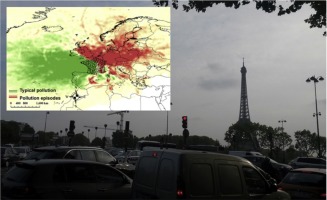
• Regional transport from Western and Central Europe added up to PM10 and PM2.5 episodes.
For the years 2008–2013, particles of diameter <10 and 2.5 μm (PM10 and PM2.5, respectively), NOx, SO2, and O3 concentrations at urban, suburban, rural, and traffic sites in the Paris metropolitan area were analyzed. Strong spatial variability at traffic and rural sites and relatively uniform profiles at urban and suburban sites for PM10, PM2.5, and O3 were observed. The O3 weekend effect was induced by lower NOx emissions during the weekend, and favored volatile organic compounds (VOCs)-limited atmospheric conditions. In conjunction with low ambient temperature, these conditions could also favor increased formation of secondary particulate nitrates in winter. Winter air pollution events were associated with multiple pollutants, whereas those observed in spring were caused by high PM10 and PM2.5 levels. Backward trajectory analyses showed the contribution of sources in Western and Central Europe on days with high PM10, PM2.5, and O3, and a local/national component for NOx and SO2.

