- Volumes 84-95 (2024)
-
Volumes 72-83 (2023)
-
Volume 83
Pages 1-258 (December 2023)
-
Volume 82
Pages 1-204 (November 2023)
-
Volume 81
Pages 1-188 (October 2023)
-
Volume 80
Pages 1-202 (September 2023)
-
Volume 79
Pages 1-172 (August 2023)
-
Volume 78
Pages 1-146 (July 2023)
-
Volume 77
Pages 1-152 (June 2023)
-
Volume 76
Pages 1-176 (May 2023)
-
Volume 75
Pages 1-228 (April 2023)
-
Volume 74
Pages 1-200 (March 2023)
-
Volume 73
Pages 1-138 (February 2023)
-
Volume 72
Pages 1-144 (January 2023)
-
Volume 83
-
Volumes 60-71 (2022)
-
Volume 71
Pages 1-108 (December 2022)
-
Volume 70
Pages 1-106 (November 2022)
-
Volume 69
Pages 1-122 (October 2022)
-
Volume 68
Pages 1-124 (September 2022)
-
Volume 67
Pages 1-102 (August 2022)
-
Volume 66
Pages 1-112 (July 2022)
-
Volume 65
Pages 1-138 (June 2022)
-
Volume 64
Pages 1-186 (May 2022)
-
Volume 63
Pages 1-124 (April 2022)
-
Volume 62
Pages 1-104 (March 2022)
-
Volume 61
Pages 1-120 (February 2022)
-
Volume 60
Pages 1-124 (January 2022)
-
Volume 71
- Volumes 54-59 (2021)
- Volumes 48-53 (2020)
- Volumes 42-47 (2019)
- Volumes 36-41 (2018)
- Volumes 30-35 (2017)
- Volumes 24-29 (2016)
- Volumes 18-23 (2015)
- Volumes 12-17 (2014)
- Volume 11 (2013)
- Volume 10 (2012)
- Volume 9 (2011)
- Volume 8 (2010)
- Volume 7 (2009)
- Volume 6 (2008)
- Volume 5 (2007)
- Volume 4 (2006)
- Volume 3 (2005)
- Volume 2 (2004)
- Volume 1 (2003)
• Hydrodynamics of a gas–liquid–solid fluidized bed was investigated in state space domain.
• S statistics test on pressure signals of a gas–liquid–solid fluidized bed was applied.
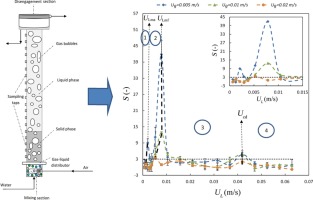
• S statistics test revealed three transition velocities, and four distinct fluidization regimes.
• The test showed the effect of various operating conditions on the hydrodynamics in beds.
The hydrodynamics of a gas–liquid–solid fluidized bed was investigated by applying the S statistics method to pressure fluctuations measured under various operating conditions in a laboratory-scale bed. S statistics tests reveal the existence of three transition velocities, especially at low gas velocities. Four distinct fluidization regimes, namely, the compacted bed, agitated bed and coalesced and discrete bubble regimes were detected. A comparison of reconstructed attractors of pressure fluctuations measured at different axial positions along the riser and with various solid loadings showed significant differences in the signals compared before fluidization, especially at minimum liquid agitation velocity. Close to the minimum liquid fluidization velocity and high liquid velocities, the variation in particle size has an insignificant effect on the bed hydrodynamics. Therefore, S statistics is a reliable method to demarcate different fluidization regimes and to characterize the influence of various operating conditions on the hydrodynamics of gas–liquid–solid fluidized beds. The method is applicable in large-scale industrial installations to detect dynamic changes within a bed, such as regime transitions or agglomeration.

