- Volumes 84-95 (2024)
-
Volumes 72-83 (2023)
-
Volume 83
Pages 1-258 (December 2023)
-
Volume 82
Pages 1-204 (November 2023)
-
Volume 81
Pages 1-188 (October 2023)
-
Volume 80
Pages 1-202 (September 2023)
-
Volume 79
Pages 1-172 (August 2023)
-
Volume 78
Pages 1-146 (July 2023)
-
Volume 77
Pages 1-152 (June 2023)
-
Volume 76
Pages 1-176 (May 2023)
-
Volume 75
Pages 1-228 (April 2023)
-
Volume 74
Pages 1-200 (March 2023)
-
Volume 73
Pages 1-138 (February 2023)
-
Volume 72
Pages 1-144 (January 2023)
-
Volume 83
-
Volumes 60-71 (2022)
-
Volume 71
Pages 1-108 (December 2022)
-
Volume 70
Pages 1-106 (November 2022)
-
Volume 69
Pages 1-122 (October 2022)
-
Volume 68
Pages 1-124 (September 2022)
-
Volume 67
Pages 1-102 (August 2022)
-
Volume 66
Pages 1-112 (July 2022)
-
Volume 65
Pages 1-138 (June 2022)
-
Volume 64
Pages 1-186 (May 2022)
-
Volume 63
Pages 1-124 (April 2022)
-
Volume 62
Pages 1-104 (March 2022)
-
Volume 61
Pages 1-120 (February 2022)
-
Volume 60
Pages 1-124 (January 2022)
-
Volume 71
- Volumes 54-59 (2021)
- Volumes 48-53 (2020)
- Volumes 42-47 (2019)
- Volumes 36-41 (2018)
- Volumes 30-35 (2017)
- Volumes 24-29 (2016)
- Volumes 18-23 (2015)
- Volumes 12-17 (2014)
- Volume 11 (2013)
- Volume 10 (2012)
- Volume 9 (2011)
- Volume 8 (2010)
- Volume 7 (2009)
- Volume 6 (2008)
- Volume 5 (2007)
- Volume 4 (2006)
- Volume 3 (2005)
- Volume 2 (2004)
- Volume 1 (2003)
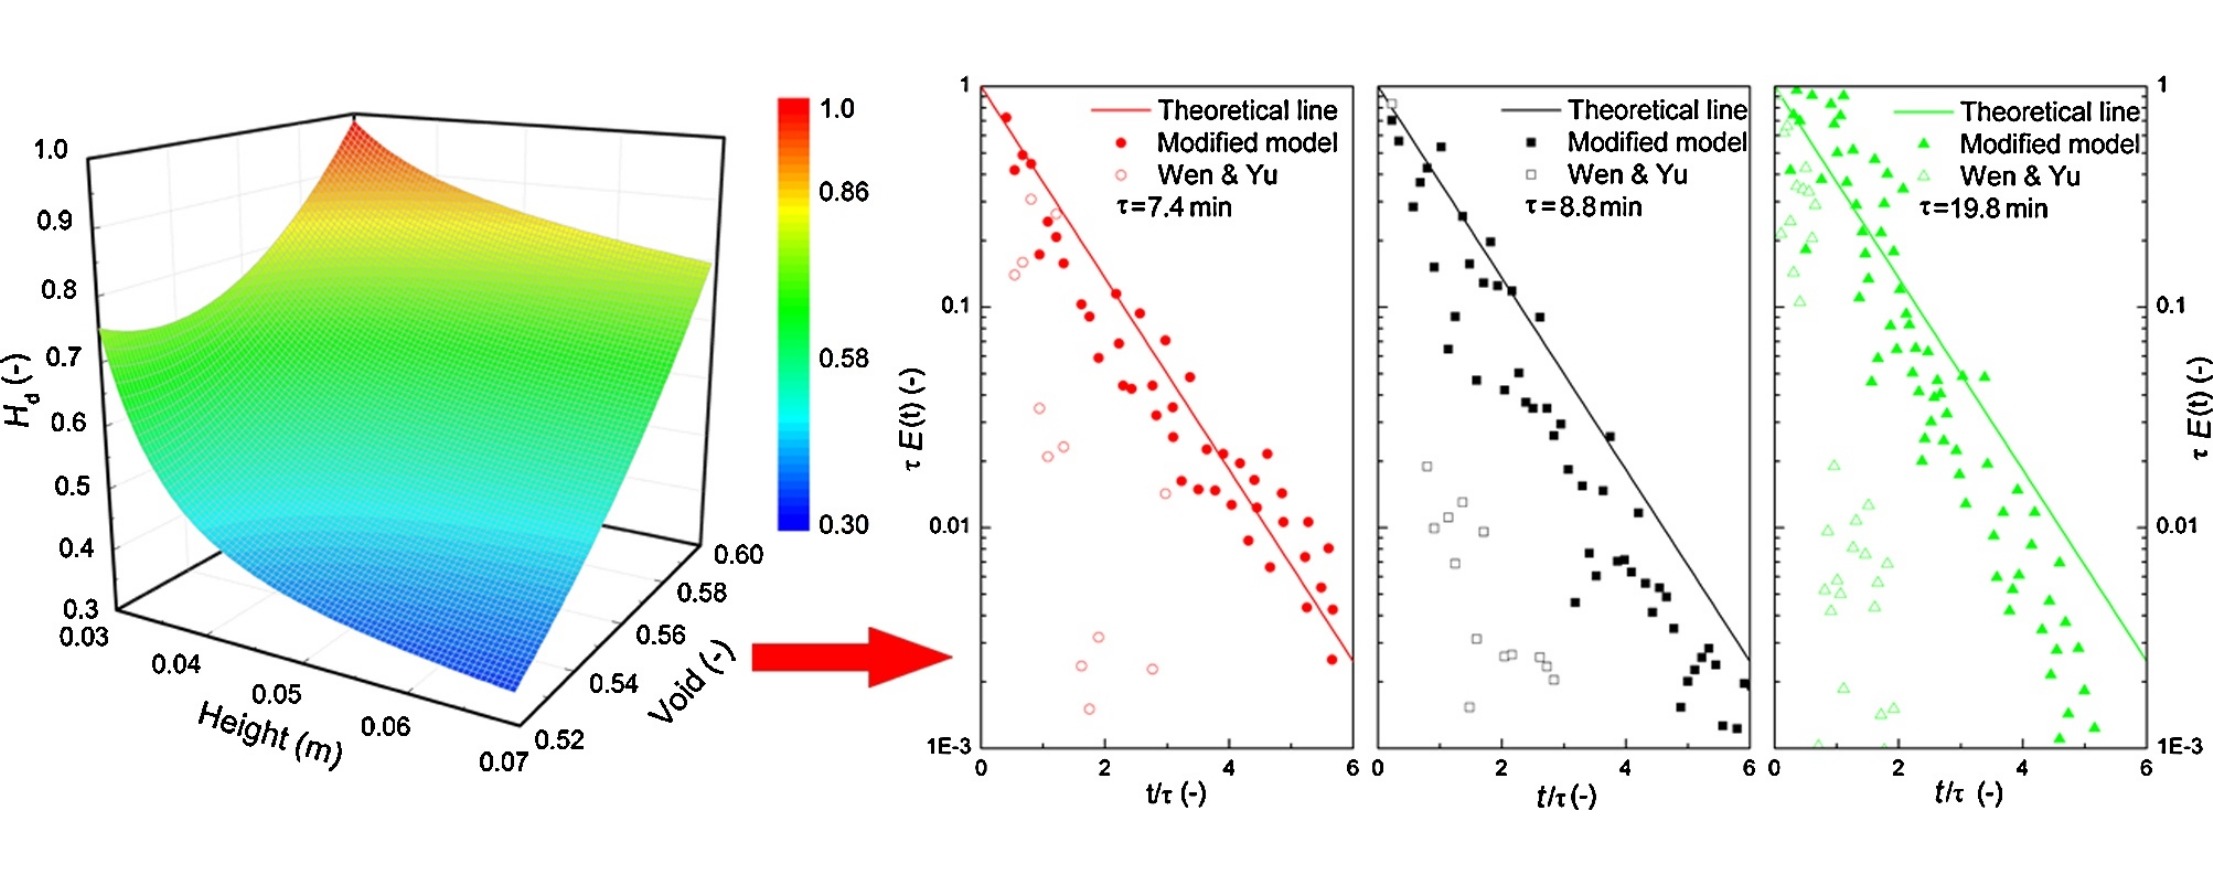
• The solids RTD and fluidized structure of BFB were simulated by using CFD.
• The simulated results showed a reasonable agreement with the theoretical value.
• The numerous small peaks on RTD curve were induced by back-mixing and aggregation of particles.
• The low value of t50 resulted in poor contact between phases.
The residence time distribution (RTD) of solids and the fluidized structure of a bubbling fluidized bed were investigated numerically using computational fluid dynamics simulations coupled with the modified structure-based drag model. A general comparison of the simulated results with theoretical values shows reasonable agreement. As the mean residence time is increased, the RTD initial peak intensity decreases and the RTD curve tail extends farther. Numerous small peaks on the RTD curve are induced by the back-mixing and aggregation of particles, which attests to the non-uniform flow structure of the bubbling fluidized bed. The low value of t50 results in poor contact between phases, and the complete exit age of the overflow particles is much longer for back-mixed solids and those caught in dead regions. The formation of a gulf-stream flow and back-mixing for solids induces an even wider spread of RTD.

