- Volumes 84-95 (2024)
-
Volumes 72-83 (2023)
-
Volume 83
Pages 1-258 (December 2023)
-
Volume 82
Pages 1-204 (November 2023)
-
Volume 81
Pages 1-188 (October 2023)
-
Volume 80
Pages 1-202 (September 2023)
-
Volume 79
Pages 1-172 (August 2023)
-
Volume 78
Pages 1-146 (July 2023)
-
Volume 77
Pages 1-152 (June 2023)
-
Volume 76
Pages 1-176 (May 2023)
-
Volume 75
Pages 1-228 (April 2023)
-
Volume 74
Pages 1-200 (March 2023)
-
Volume 73
Pages 1-138 (February 2023)
-
Volume 72
Pages 1-144 (January 2023)
-
Volume 83
-
Volumes 60-71 (2022)
-
Volume 71
Pages 1-108 (December 2022)
-
Volume 70
Pages 1-106 (November 2022)
-
Volume 69
Pages 1-122 (October 2022)
-
Volume 68
Pages 1-124 (September 2022)
-
Volume 67
Pages 1-102 (August 2022)
-
Volume 66
Pages 1-112 (July 2022)
-
Volume 65
Pages 1-138 (June 2022)
-
Volume 64
Pages 1-186 (May 2022)
-
Volume 63
Pages 1-124 (April 2022)
-
Volume 62
Pages 1-104 (March 2022)
-
Volume 61
Pages 1-120 (February 2022)
-
Volume 60
Pages 1-124 (January 2022)
-
Volume 71
- Volumes 54-59 (2021)
- Volumes 48-53 (2020)
- Volumes 42-47 (2019)
- Volumes 36-41 (2018)
- Volumes 30-35 (2017)
- Volumes 24-29 (2016)
- Volumes 18-23 (2015)
- Volumes 12-17 (2014)
- Volume 11 (2013)
- Volume 10 (2012)
- Volume 9 (2011)
- Volume 8 (2010)
- Volume 7 (2009)
- Volume 6 (2008)
- Volume 5 (2007)
- Volume 4 (2006)
- Volume 3 (2005)
- Volume 2 (2004)
- Volume 1 (2003)
• Aerosol characteristics in two metropolitan regions in China were compared.
• Aerosols were larger in the Beijing–Tianjin–Hebei metropolitan region.
• Aerosols were more regular in the Yangtze River Delta.
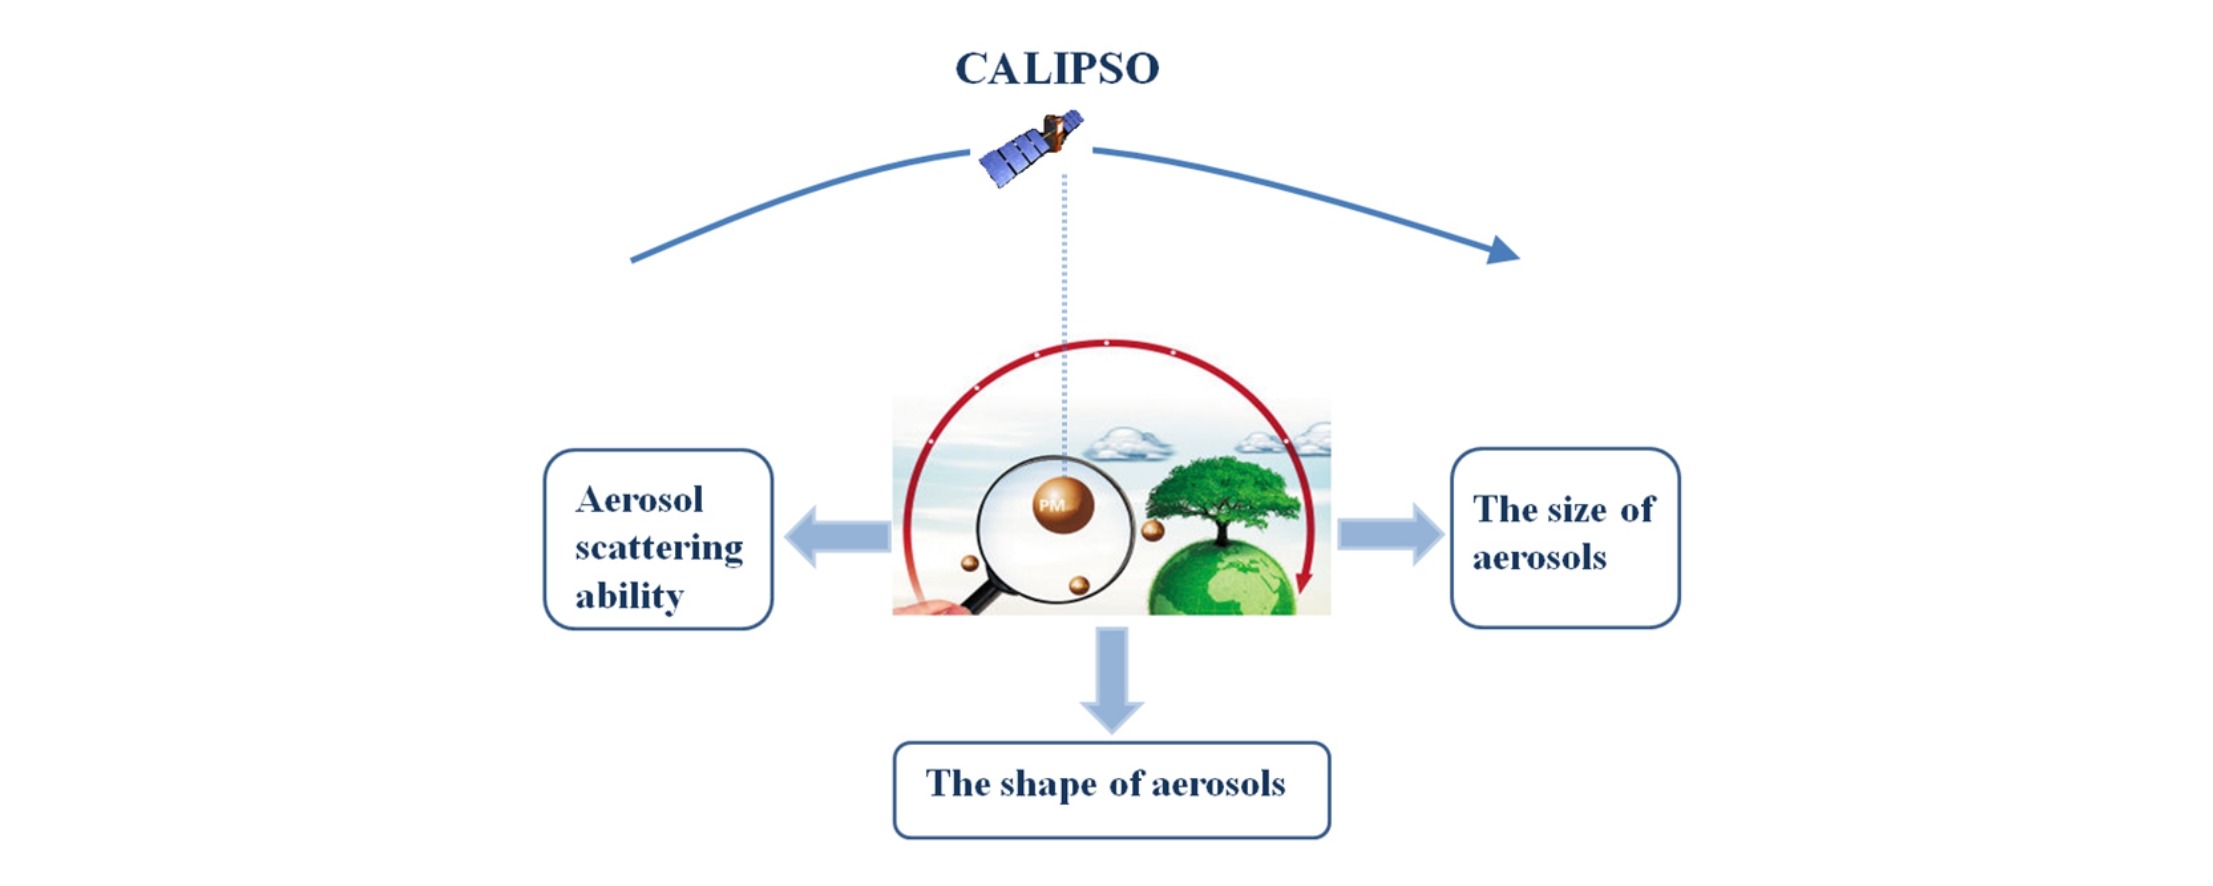
Using CALIPSO (cloud-aerosol lidar and infrared pathfinder satellite observation) vertical observation data during haze periods from January 2007 to December 2008, we analyzed differences in aerosol characteristics near the surface, as well as in the middle troposphere between the Beijing–Tianjin–Hebei metropolitan region (Area A) and the Yangtze River Delta region (Area B) in China. One significant difference was that haze pollution in Area A was related to local and non-local aerosols, while in Area B it was related to local anthropogenic sources. In all seasons apart from autumn, aerosol pollution in Area A was more severe than in Area B, both near the surface and at higher altitudes. In Area A, non-spherical aerosols were dominant from 0 to 4 km in spring, summer, and winter; while in autumn, there were considerably high numbers of non-spherical aerosols below 0.5 km, and near-spherical aerosols from 0.5 to 4 km. In Area B, both near-spherical and non-spherical aerosols were common in all seasons. Moreover, aerosols with attenuated color ratios of 0–0.2 were more common in all seasons in Area A than in Area B, indicating that fine particle pollution in Area A was more serious than in Area B. Finally, relatively large aerosols linked to gravity settling appeared more frequently near the surface in Area A than in Area B.

