- Volumes 84-95 (2024)
-
Volumes 72-83 (2023)
-
Volume 83
Pages 1-258 (December 2023)
-
Volume 82
Pages 1-204 (November 2023)
-
Volume 81
Pages 1-188 (October 2023)
-
Volume 80
Pages 1-202 (September 2023)
-
Volume 79
Pages 1-172 (August 2023)
-
Volume 78
Pages 1-146 (July 2023)
-
Volume 77
Pages 1-152 (June 2023)
-
Volume 76
Pages 1-176 (May 2023)
-
Volume 75
Pages 1-228 (April 2023)
-
Volume 74
Pages 1-200 (March 2023)
-
Volume 73
Pages 1-138 (February 2023)
-
Volume 72
Pages 1-144 (January 2023)
-
Volume 83
-
Volumes 60-71 (2022)
-
Volume 71
Pages 1-108 (December 2022)
-
Volume 70
Pages 1-106 (November 2022)
-
Volume 69
Pages 1-122 (October 2022)
-
Volume 68
Pages 1-124 (September 2022)
-
Volume 67
Pages 1-102 (August 2022)
-
Volume 66
Pages 1-112 (July 2022)
-
Volume 65
Pages 1-138 (June 2022)
-
Volume 64
Pages 1-186 (May 2022)
-
Volume 63
Pages 1-124 (April 2022)
-
Volume 62
Pages 1-104 (March 2022)
-
Volume 61
Pages 1-120 (February 2022)
-
Volume 60
Pages 1-124 (January 2022)
-
Volume 71
- Volumes 54-59 (2021)
- Volumes 48-53 (2020)
- Volumes 42-47 (2019)
- Volumes 36-41 (2018)
- Volumes 30-35 (2017)
- Volumes 24-29 (2016)
- Volumes 18-23 (2015)
- Volumes 12-17 (2014)
- Volume 11 (2013)
- Volume 10 (2012)
- Volume 9 (2011)
- Volume 8 (2010)
- Volume 7 (2009)
- Volume 6 (2008)
- Volume 5 (2007)
- Volume 4 (2006)
- Volume 3 (2005)
- Volume 2 (2004)
- Volume 1 (2003)
• Separation of PM1 and PM2.5–1 showed evident differences regarding their quantity and composition.
• Ratios of various carbonaceous compounds in PM-fractions indicated the benefit of PM1 sampling.
• Results suggest that PM1 measurement together with PM2.5 mirrored better the actual air pollution.
• Elevated sampling air temperatures (>50 °C) influenced mass concentration of PM1 fraction.
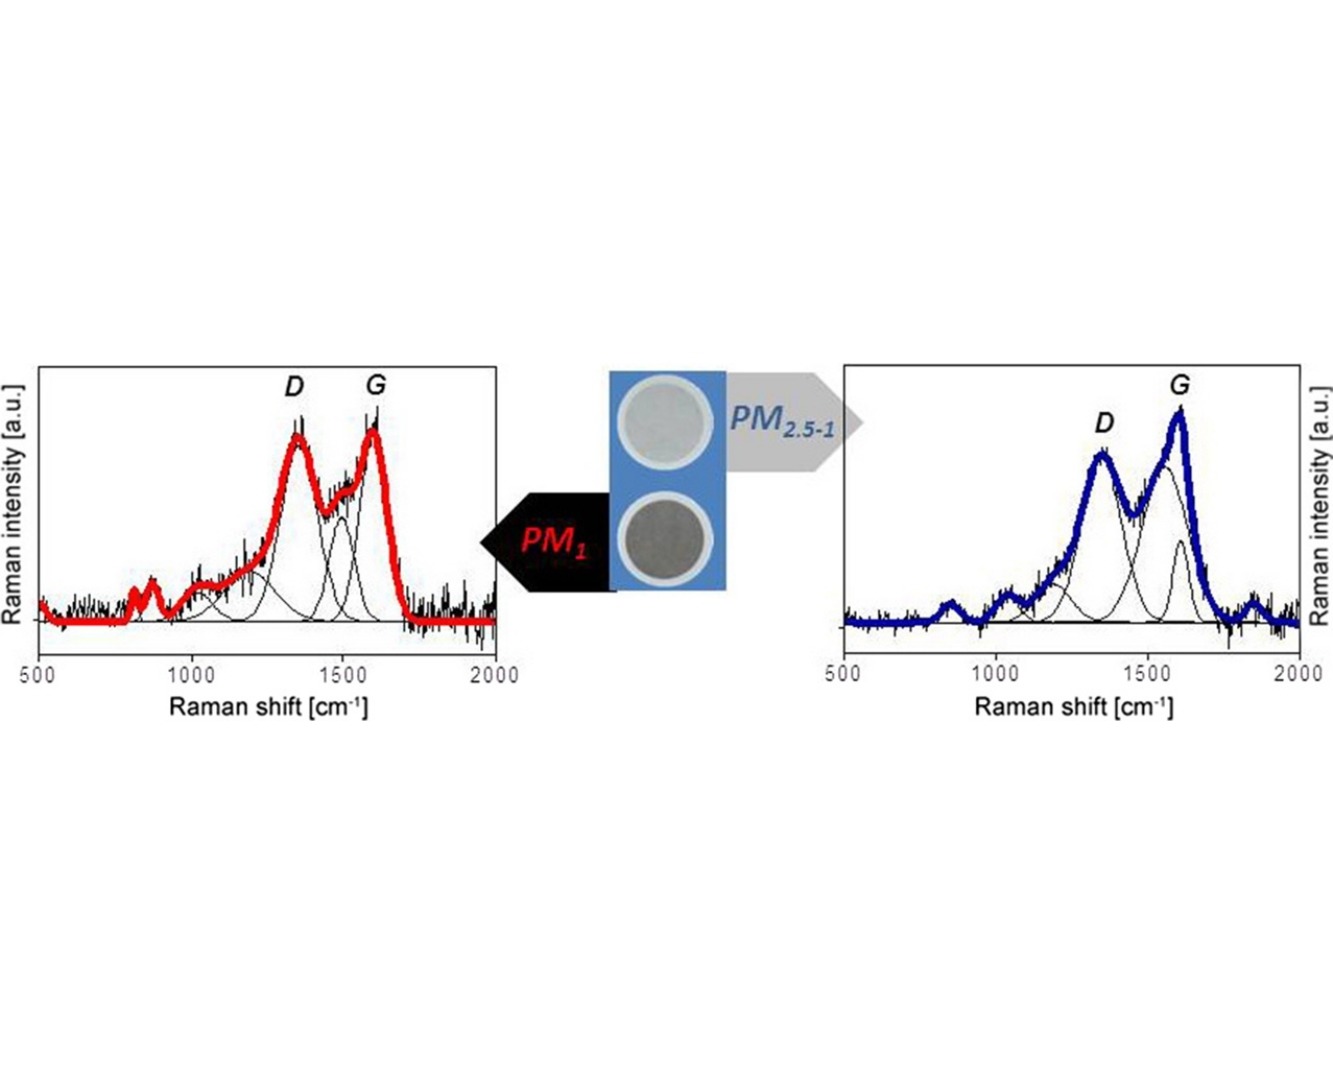
Urban ambient aerosols in the size range below 10 μm were measured and sampled for further evaluation (by Raman and Thermal-Optical analysis) of the collected material. The presented data shows that monitoring number and/or surface area concentrations besides the mass concentration provides valuable information for a meaningful assessment of the actual ambient air quality. The aim of the study was to characterize the urban aerosols using various instruments, methods, and sampling conditions, and to determine whether a split of the PM2.5 size fraction at PM1 may deliver a more sensible indication of the actual air quality than the current standard of monitoring PM2.5. We found substantial differences relating to this split. PM2.5 data frequently include particles from both mechanical and combustion processes. PM1 measurements can be used to better distinguish particles derived from these two sources. We measured number concentrations of PM1 with PM2.5–1 concurrently with particle mass concentration and found that the typical average particle diameter by mass in the urban aerosols investigated was in the range of 120 nm; this corresponded well with the particle number size distributions measured in real time. Raman spectral analysis and thermal-optical evaluation of the sampled material also suggested that it would be sensible to split the measurement of the PM2.5 fraction into PM1 and PM2.5–1 size fractions, especially for analysis of carbonaceous aerosol components using the DRI thermal/optical reflectance carbon analysis system

