- Volumes 84-95 (2024)
-
Volumes 72-83 (2023)
-
Volume 83
Pages 1-258 (December 2023)
-
Volume 82
Pages 1-204 (November 2023)
-
Volume 81
Pages 1-188 (October 2023)
-
Volume 80
Pages 1-202 (September 2023)
-
Volume 79
Pages 1-172 (August 2023)
-
Volume 78
Pages 1-146 (July 2023)
-
Volume 77
Pages 1-152 (June 2023)
-
Volume 76
Pages 1-176 (May 2023)
-
Volume 75
Pages 1-228 (April 2023)
-
Volume 74
Pages 1-200 (March 2023)
-
Volume 73
Pages 1-138 (February 2023)
-
Volume 72
Pages 1-144 (January 2023)
-
Volume 83
-
Volumes 60-71 (2022)
-
Volume 71
Pages 1-108 (December 2022)
-
Volume 70
Pages 1-106 (November 2022)
-
Volume 69
Pages 1-122 (October 2022)
-
Volume 68
Pages 1-124 (September 2022)
-
Volume 67
Pages 1-102 (August 2022)
-
Volume 66
Pages 1-112 (July 2022)
-
Volume 65
Pages 1-138 (June 2022)
-
Volume 64
Pages 1-186 (May 2022)
-
Volume 63
Pages 1-124 (April 2022)
-
Volume 62
Pages 1-104 (March 2022)
-
Volume 61
Pages 1-120 (February 2022)
-
Volume 60
Pages 1-124 (January 2022)
-
Volume 71
- Volumes 54-59 (2021)
- Volumes 48-53 (2020)
- Volumes 42-47 (2019)
- Volumes 36-41 (2018)
- Volumes 30-35 (2017)
- Volumes 24-29 (2016)
- Volumes 18-23 (2015)
- Volumes 12-17 (2014)
- Volume 11 (2013)
- Volume 10 (2012)
- Volume 9 (2011)
- Volume 8 (2010)
- Volume 7 (2009)
- Volume 6 (2008)
- Volume 5 (2007)
- Volume 4 (2006)
- Volume 3 (2005)
- Volume 2 (2004)
- Volume 1 (2003)
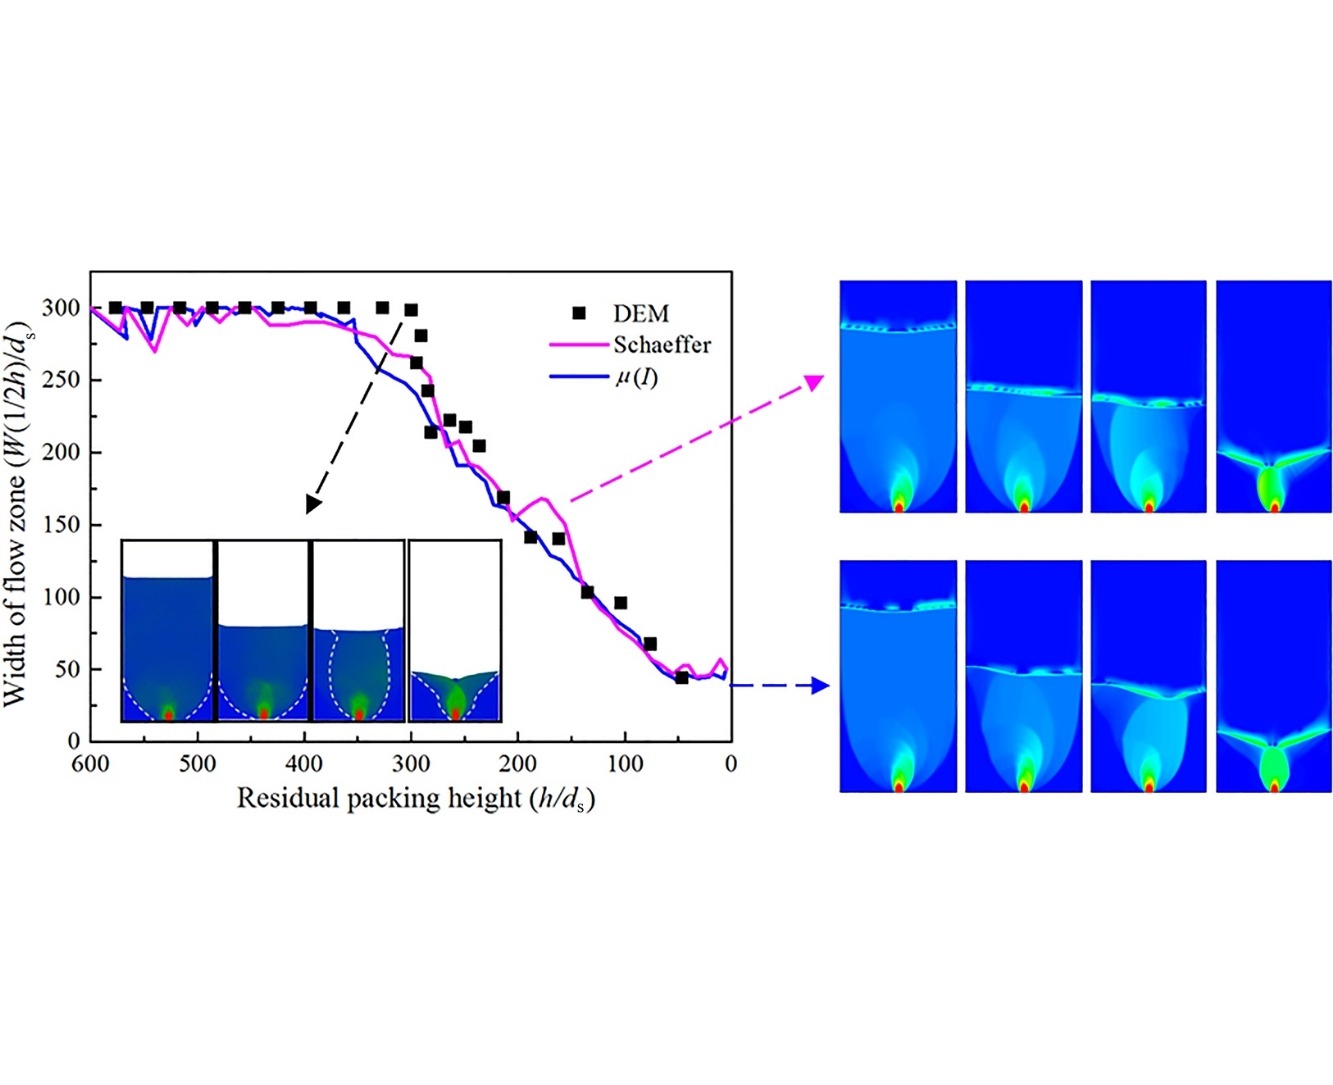
• Flow mode transition of granular material in a flat-bottomed silo was studied.
• The evolution of flowing zone width showed a history-dependent characteristic.
• Both Schaeffer and μ(I) model can predict the flow patterns given by DEM simulations.
• S–S model gave a consistent type B flow mode.
• All the three considered frictional viscosity models over-estimated the discharge rate.
Granular material discharge from a flat-bottomed silo has been simulated by using continuum modeling and a three-dimensional discrete-element method (DEM). The predictive abilities of three commonly used frictional viscosity models (Schaeffer, S–S, and μ(I)) were evaluated by comparing them with the DEM data. The funnel-flow pattern (type C) and the semi-mass-flow pattern (type B) that was predicted by DEM simulations can be represented when the Schaeffer or μ(I) model is used, whereas the S–S model gives a consistent type-B flow pattern. All three models over-estimate the discharge rate compared with the DEM. The profiles of the solids volume fraction and the vertical velocity above the outlet show that the larger discharge rates given by the Schaeffer and μ(I) model result from an over-estimation of volume fraction, whereas the deviation in the S–S model stems from the failure to predict a solid vertical velocity and a volume fraction.

