- Volumes 84-95 (2024)
-
Volumes 72-83 (2023)
-
Volume 83
Pages 1-258 (December 2023)
-
Volume 82
Pages 1-204 (November 2023)
-
Volume 81
Pages 1-188 (October 2023)
-
Volume 80
Pages 1-202 (September 2023)
-
Volume 79
Pages 1-172 (August 2023)
-
Volume 78
Pages 1-146 (July 2023)
-
Volume 77
Pages 1-152 (June 2023)
-
Volume 76
Pages 1-176 (May 2023)
-
Volume 75
Pages 1-228 (April 2023)
-
Volume 74
Pages 1-200 (March 2023)
-
Volume 73
Pages 1-138 (February 2023)
-
Volume 72
Pages 1-144 (January 2023)
-
Volume 83
-
Volumes 60-71 (2022)
-
Volume 71
Pages 1-108 (December 2022)
-
Volume 70
Pages 1-106 (November 2022)
-
Volume 69
Pages 1-122 (October 2022)
-
Volume 68
Pages 1-124 (September 2022)
-
Volume 67
Pages 1-102 (August 2022)
-
Volume 66
Pages 1-112 (July 2022)
-
Volume 65
Pages 1-138 (June 2022)
-
Volume 64
Pages 1-186 (May 2022)
-
Volume 63
Pages 1-124 (April 2022)
-
Volume 62
Pages 1-104 (March 2022)
-
Volume 61
Pages 1-120 (February 2022)
-
Volume 60
Pages 1-124 (January 2022)
-
Volume 71
- Volumes 54-59 (2021)
- Volumes 48-53 (2020)
- Volumes 42-47 (2019)
- Volumes 36-41 (2018)
- Volumes 30-35 (2017)
- Volumes 24-29 (2016)
- Volumes 18-23 (2015)
- Volumes 12-17 (2014)
- Volume 11 (2013)
- Volume 10 (2012)
- Volume 9 (2011)
- Volume 8 (2010)
- Volume 7 (2009)
- Volume 6 (2008)
- Volume 5 (2007)
- Volume 4 (2006)
- Volume 3 (2005)
- Volume 2 (2004)
- Volume 1 (2003)
• Annual mean PM2.5 concentration exceeded WHO and USEPA limits but was within CPCB, India limit.
• PM10 at the study location exceeded the CPCB and USEPA limits.
• BC contributed the most to the observed PM2.5, followed by Si and S.
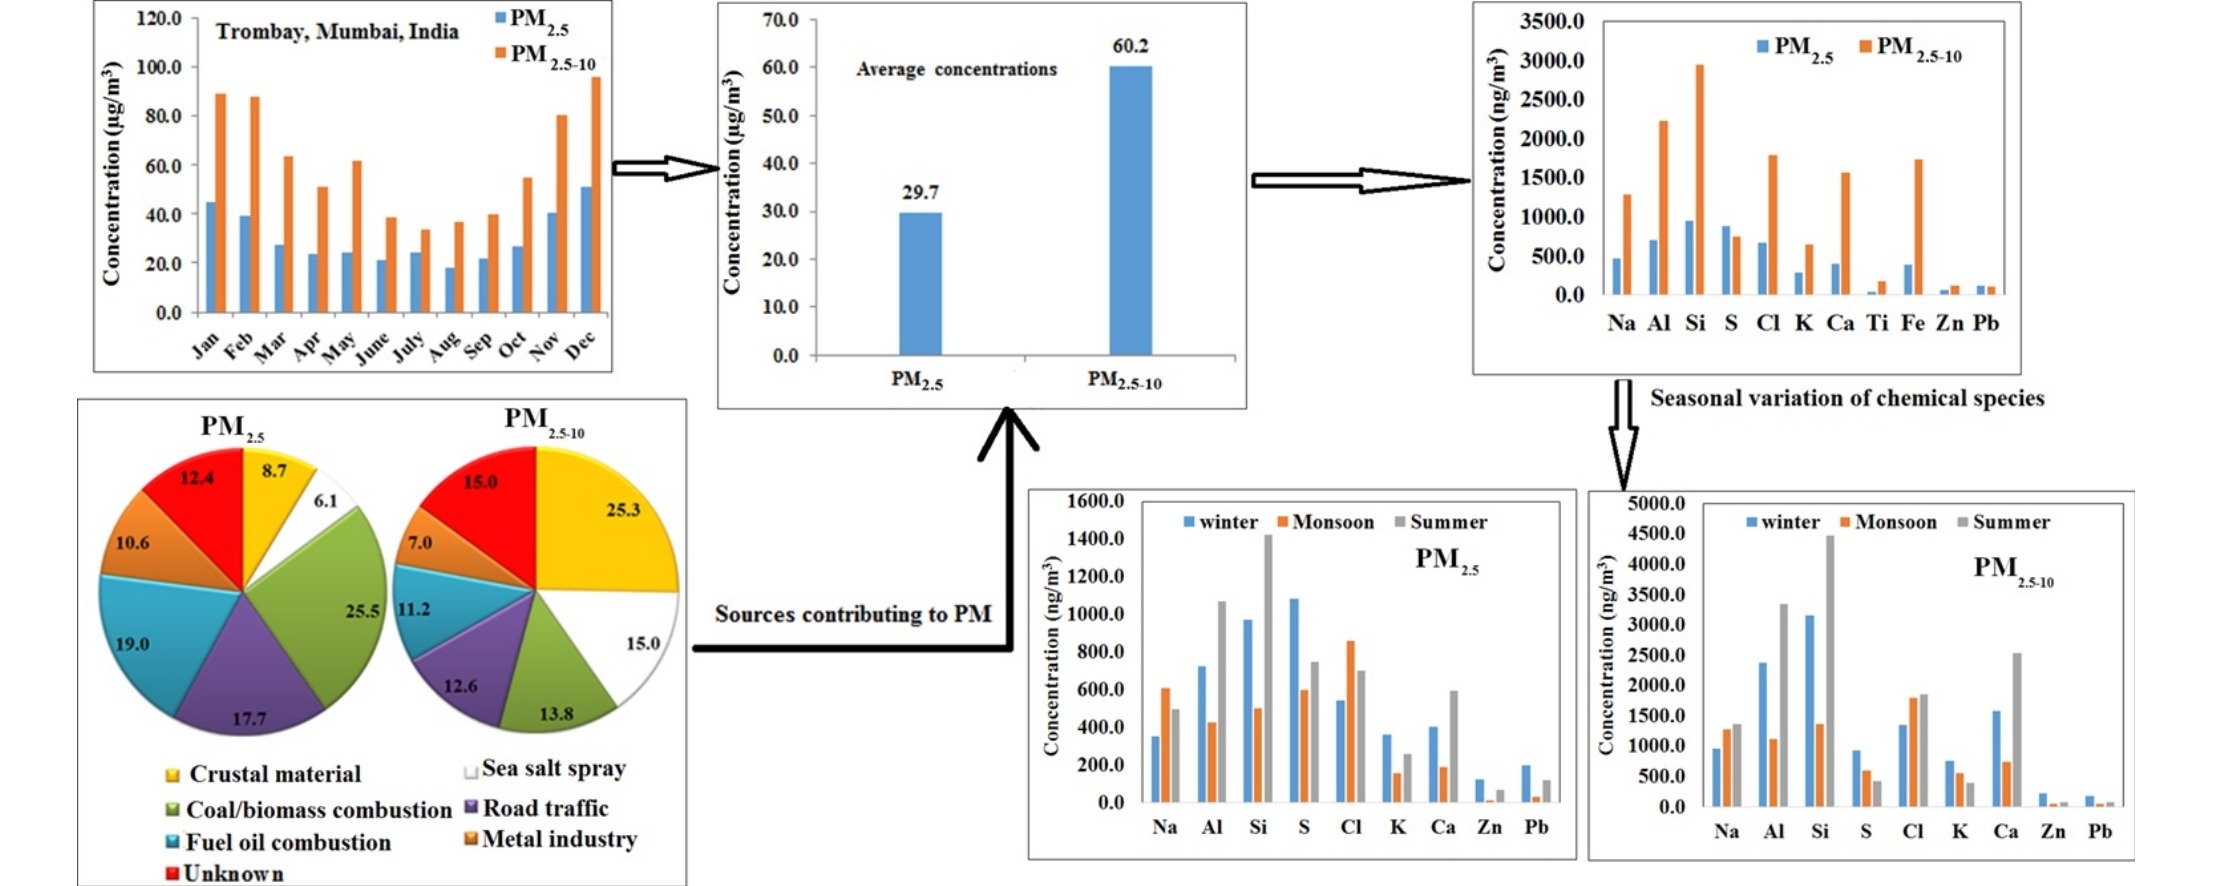
• PM2.5 has major contributions from anthropogenic sources such as coal/biomass combustion (25.5%).
• Natural sources such as crustal material (25.3%) and sea salt contributed most to PM2.5–10 mass.
PM2.5 and PM2.5–10 concentrations, elemental constituents, and sources in a densely populated coastal industrial area (Trombay, Mumbai) were investigated in 2010 and 2011. The PM2.5 and PM2.5–10 concentrations were 13.50–71.60 and 22.40–127.78 μg/m3, respectively. The daily PM2.5 concentrations exceeded the Indian Central Pollution Control Board limit (60 μg/m3) several days in winter. Of the elements analyzed, Si then Al had the highest concentrations in PM2.5–10, but black carbon then Si had the highest concentrations in PM2.5. The element concentrations varied widely by season. Al, Ca, Fe, Si, and Ti concentrations were highest in summer, Cl, Mg, and Na concentrations were highest in the monsoon season, and the other trace metal concentrations in both PM2.5 and PM2.5–10 were highest in winter. The PM2.5 and PM2.5–10 sources were apportioned by positive matrix factorization. PM2.5 and PM2.5–10 had six dominant sources, crustal material (8.7% and 25.3%, respectively), sea salt spray (6.1% and 15.0%, respectively), coal/biomass combustion (25.5% and 13.8%, respectively), fuel oil combustion (19.0% and 11.2%, respectively), road traffic (17.7% and 12.6%, respectively), and the metal industry (10.6% and 7.0%, respectively). Anthropogenic sources clearly contributed most to PM2.5 but natural sources contributed most to PM2.5–10.

