- Volumes 84-95 (2024)
-
Volumes 72-83 (2023)
-
Volume 83
Pages 1-258 (December 2023)
-
Volume 82
Pages 1-204 (November 2023)
-
Volume 81
Pages 1-188 (October 2023)
-
Volume 80
Pages 1-202 (September 2023)
-
Volume 79
Pages 1-172 (August 2023)
-
Volume 78
Pages 1-146 (July 2023)
-
Volume 77
Pages 1-152 (June 2023)
-
Volume 76
Pages 1-176 (May 2023)
-
Volume 75
Pages 1-228 (April 2023)
-
Volume 74
Pages 1-200 (March 2023)
-
Volume 73
Pages 1-138 (February 2023)
-
Volume 72
Pages 1-144 (January 2023)
-
Volume 83
-
Volumes 60-71 (2022)
-
Volume 71
Pages 1-108 (December 2022)
-
Volume 70
Pages 1-106 (November 2022)
-
Volume 69
Pages 1-122 (October 2022)
-
Volume 68
Pages 1-124 (September 2022)
-
Volume 67
Pages 1-102 (August 2022)
-
Volume 66
Pages 1-112 (July 2022)
-
Volume 65
Pages 1-138 (June 2022)
-
Volume 64
Pages 1-186 (May 2022)
-
Volume 63
Pages 1-124 (April 2022)
-
Volume 62
Pages 1-104 (March 2022)
-
Volume 61
Pages 1-120 (February 2022)
-
Volume 60
Pages 1-124 (January 2022)
-
Volume 71
- Volumes 54-59 (2021)
- Volumes 48-53 (2020)
- Volumes 42-47 (2019)
- Volumes 36-41 (2018)
- Volumes 30-35 (2017)
- Volumes 24-29 (2016)
- Volumes 18-23 (2015)
- Volumes 12-17 (2014)
- Volume 11 (2013)
- Volume 10 (2012)
- Volume 9 (2011)
- Volume 8 (2010)
- Volume 7 (2009)
- Volume 6 (2008)
- Volume 5 (2007)
- Volume 4 (2006)
- Volume 3 (2005)
- Volume 2 (2004)
- Volume 1 (2003)
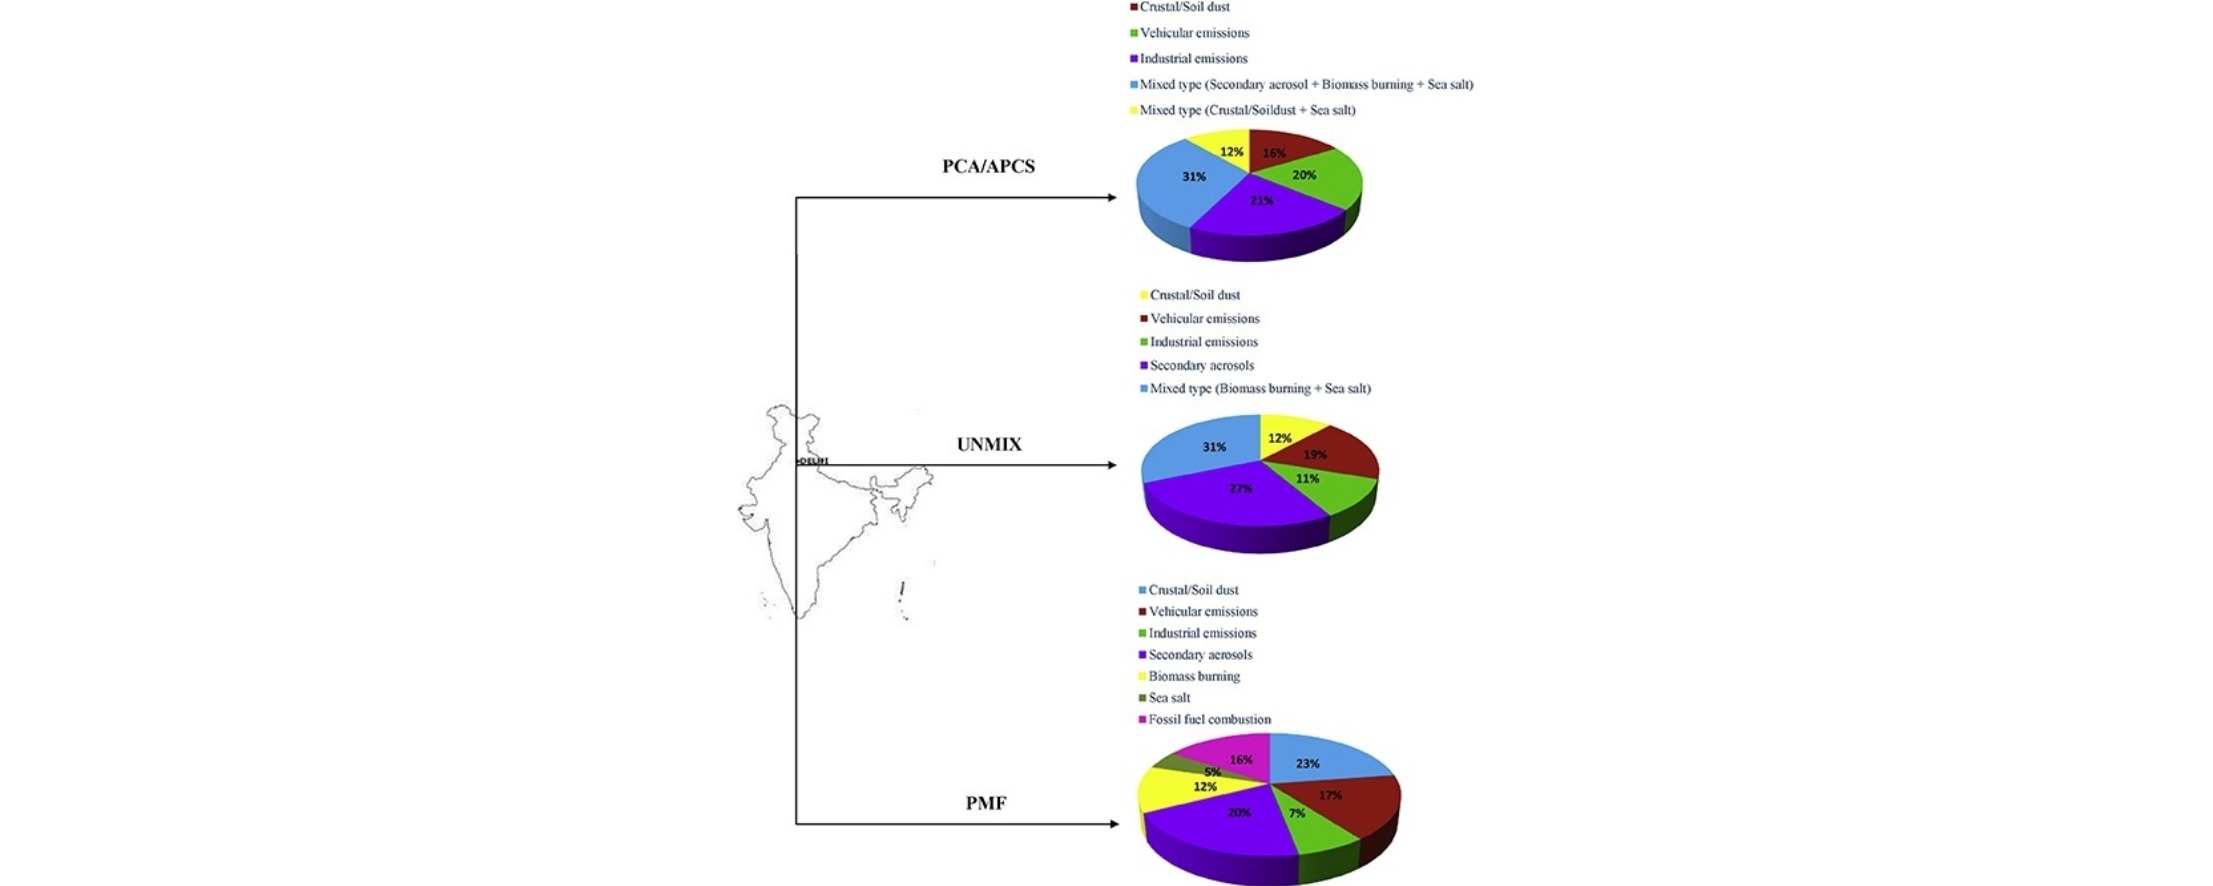
• Comparisons of receptor models, i.e. PCA/APCS, UNMIX and PMF, were conducted.
• Source profiles and contributions of PM10 were achieved by receptor models.
• VE, SA and SD were dominant contributors to PM10 in Delhi.
• PMF allowed to obtain better results than PCA/APCS and UNMIX.
Source apportionment of particulate matter (PM10) measurements taken in Delhi, India between January 2013 and June 2014 was carried out using two receptor models, principal component analysis with absolute principal component scores (PCA/APCS) and UNMIX. The results were compared with previous estimates generated using the positive matrix factorization (PMF) receptor model to investigate each model's source-apportioning capability. All models used the PM10 chemical composition (organic carbon (OC), elemental carbon (EC), water soluble inorganic ions (WSIC), and trace elements) for source apportionment. The average PM10 concentration during the study period was 249.7 ± 103.9 μg/m3 (range: 61.4–584.8 μg/m3). The UNMIX model resolved five sources (soil dust (SD), vehicular emissions (VE), secondary aerosols (SA), a mixed source of biomass burning (BB) and sea salt (SS), and industrial emissions (IE)). The PCA/APCS model also resolved five sources, two of which also included mixed sources (SD, VE, SD+SS, (SA+BB+SS) and IE). The PMF analysis differentiated seven individual sources (SD, VE, SA, BB, SS, IE, and fossil fuel combustion (FFC)). All models identified the main sources contributing to PM10 emissions and reconfirmed that VE, SA, BB, and SD were the dominant contributors in Delhi.

