- Volumes 84-95 (2024)
-
Volumes 72-83 (2023)
-
Volume 83
Pages 1-258 (December 2023)
-
Volume 82
Pages 1-204 (November 2023)
-
Volume 81
Pages 1-188 (October 2023)
-
Volume 80
Pages 1-202 (September 2023)
-
Volume 79
Pages 1-172 (August 2023)
-
Volume 78
Pages 1-146 (July 2023)
-
Volume 77
Pages 1-152 (June 2023)
-
Volume 76
Pages 1-176 (May 2023)
-
Volume 75
Pages 1-228 (April 2023)
-
Volume 74
Pages 1-200 (March 2023)
-
Volume 73
Pages 1-138 (February 2023)
-
Volume 72
Pages 1-144 (January 2023)
-
Volume 83
-
Volumes 60-71 (2022)
-
Volume 71
Pages 1-108 (December 2022)
-
Volume 70
Pages 1-106 (November 2022)
-
Volume 69
Pages 1-122 (October 2022)
-
Volume 68
Pages 1-124 (September 2022)
-
Volume 67
Pages 1-102 (August 2022)
-
Volume 66
Pages 1-112 (July 2022)
-
Volume 65
Pages 1-138 (June 2022)
-
Volume 64
Pages 1-186 (May 2022)
-
Volume 63
Pages 1-124 (April 2022)
-
Volume 62
Pages 1-104 (March 2022)
-
Volume 61
Pages 1-120 (February 2022)
-
Volume 60
Pages 1-124 (January 2022)
-
Volume 71
- Volumes 54-59 (2021)
- Volumes 48-53 (2020)
- Volumes 42-47 (2019)
- Volumes 36-41 (2018)
- Volumes 30-35 (2017)
- Volumes 24-29 (2016)
- Volumes 18-23 (2015)
- Volumes 12-17 (2014)
- Volume 11 (2013)
- Volume 10 (2012)
- Volume 9 (2011)
- Volume 8 (2010)
- Volume 7 (2009)
- Volume 6 (2008)
- Volume 5 (2007)
- Volume 4 (2006)
- Volume 3 (2005)
- Volume 2 (2004)
- Volume 1 (2003)
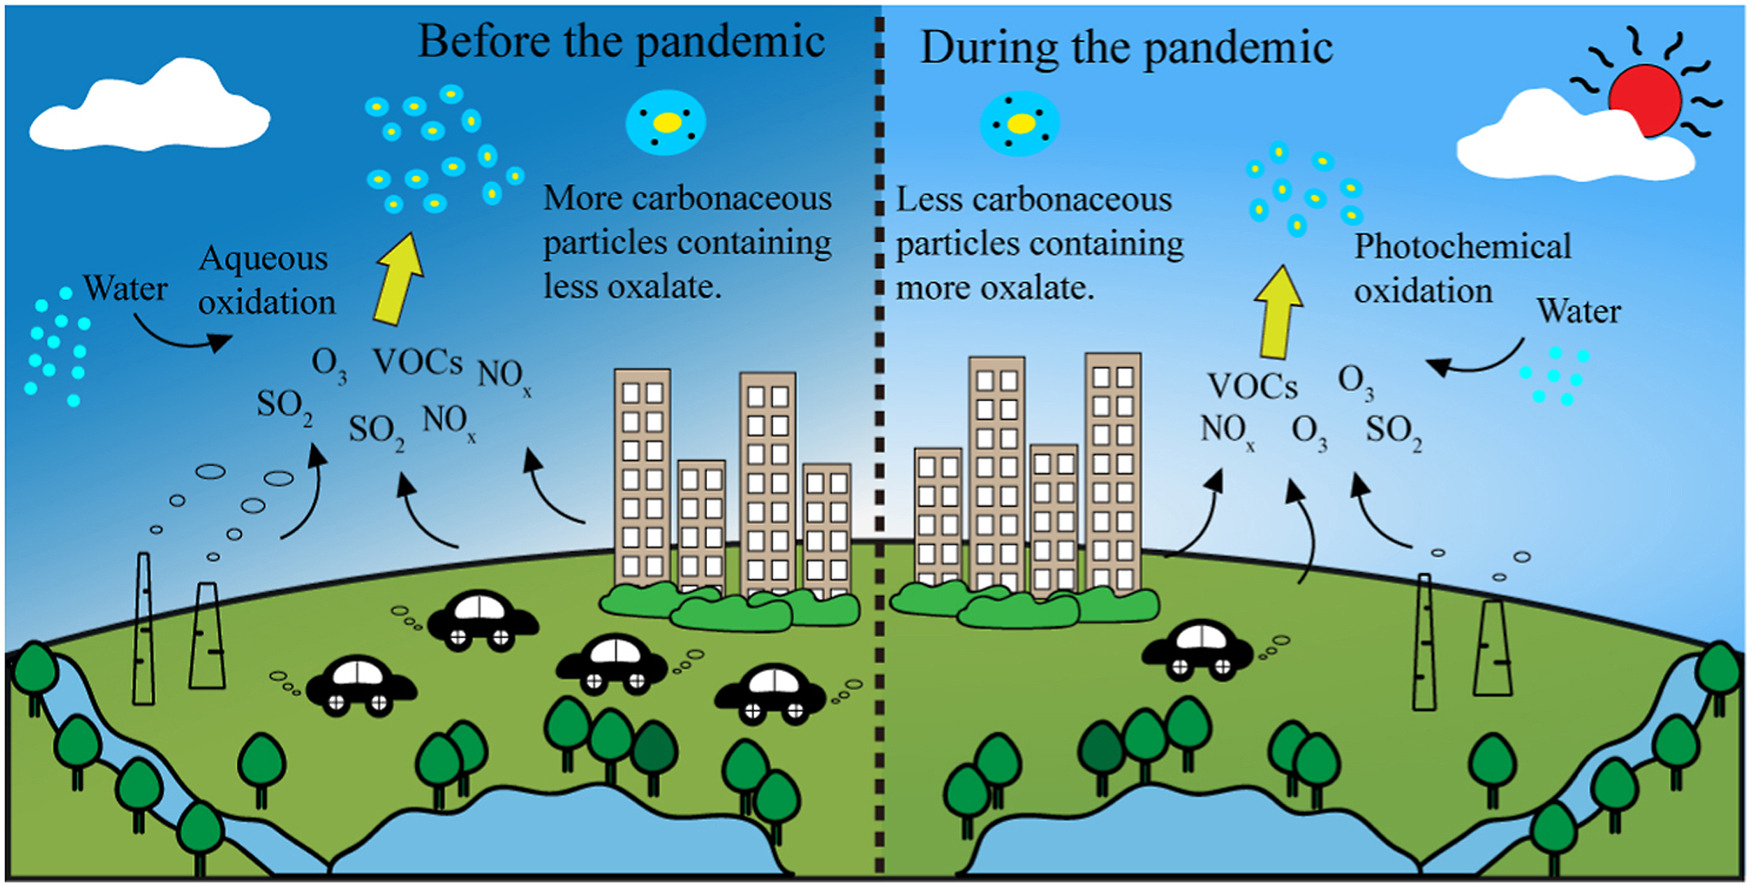
To investigate the effect of COVID-19 control measures on aerosol chemistry, the chemical compositions, mixing states, and formation mechanisms of carbonaceous particles in the urban atmosphere of Liaocheng in the North China Plain (NCP) were compared before and during the pandemic using a single particle aerosol mass spectrometry (SPAMS). The results showed that the concentrations of five air pollutants including PM2.5, PM10, SO2, NO2, and CO decreased by 41.2%–71.5% during the pandemic compared to those before the pandemic, whereas O3 increased by 1.3 times during the pandemic because of the depressed titration of O3 and more favorable meteorological conditions. The count and percentage contribution of carbonaceous particles in the total detected particles were lower during the pandemic than those before the pandemic. The carbonaceous particles were dominated by elemental and organic carbon (ECOC, 35.9%), followed by elemental carbon-aged (EC-aged, 19.6%) and organic carbon-fresh (OC-fresh, 13.5%) before the pandemic, while EC-aged (25.3%), ECOC (17.9%), and secondary ions-rich (SEC, 17.8%) became the predominant species during the pandemic. The carbonaceous particle sizes during the pandemic showed a broader distribution than that before the pandemic, due to the condensation and coagulation of carbonaceous particles in the aging processes. The relative aerosol acidity (Rra) was smaller before the pandemic than that during the pandemic, indicating the more acidic particle aerosol during the pandemic closely related to the secondary species and relative humidity (RH). More than 95.0% and 86.0% of carbonaceous particles in the whole period were internally mixed with nitrate and sulfate, implying that most of the carbonaceous particles were associated with secondary oxidation during their formation processes. The diurnal variations of oxalate particles and correlation analyses suggested that oxalate particles before the pandemic were derived from aqueous oxidation driven by RH and liquid water content (LWC), while oxalate particles during the pandemic were originated from O3-dominated photochemical oxidation.

