- Volumes 84-95 (2024)
-
Volumes 72-83 (2023)
-
Volume 83
Pages 1-258 (December 2023)
-
Volume 82
Pages 1-204 (November 2023)
-
Volume 81
Pages 1-188 (October 2023)
-
Volume 80
Pages 1-202 (September 2023)
-
Volume 79
Pages 1-172 (August 2023)
-
Volume 78
Pages 1-146 (July 2023)
-
Volume 77
Pages 1-152 (June 2023)
-
Volume 76
Pages 1-176 (May 2023)
-
Volume 75
Pages 1-228 (April 2023)
-
Volume 74
Pages 1-200 (March 2023)
-
Volume 73
Pages 1-138 (February 2023)
-
Volume 72
Pages 1-144 (January 2023)
-
Volume 83
-
Volumes 60-71 (2022)
-
Volume 71
Pages 1-108 (December 2022)
-
Volume 70
Pages 1-106 (November 2022)
-
Volume 69
Pages 1-122 (October 2022)
-
Volume 68
Pages 1-124 (September 2022)
-
Volume 67
Pages 1-102 (August 2022)
-
Volume 66
Pages 1-112 (July 2022)
-
Volume 65
Pages 1-138 (June 2022)
-
Volume 64
Pages 1-186 (May 2022)
-
Volume 63
Pages 1-124 (April 2022)
-
Volume 62
Pages 1-104 (March 2022)
-
Volume 61
Pages 1-120 (February 2022)
-
Volume 60
Pages 1-124 (January 2022)
-
Volume 71
- Volumes 54-59 (2021)
- Volumes 48-53 (2020)
- Volumes 42-47 (2019)
- Volumes 36-41 (2018)
- Volumes 30-35 (2017)
- Volumes 24-29 (2016)
- Volumes 18-23 (2015)
- Volumes 12-17 (2014)
- Volume 11 (2013)
- Volume 10 (2012)
- Volume 9 (2011)
- Volume 8 (2010)
- Volume 7 (2009)
- Volume 6 (2008)
- Volume 5 (2007)
- Volume 4 (2006)
- Volume 3 (2005)
- Volume 2 (2004)
- Volume 1 (2003)
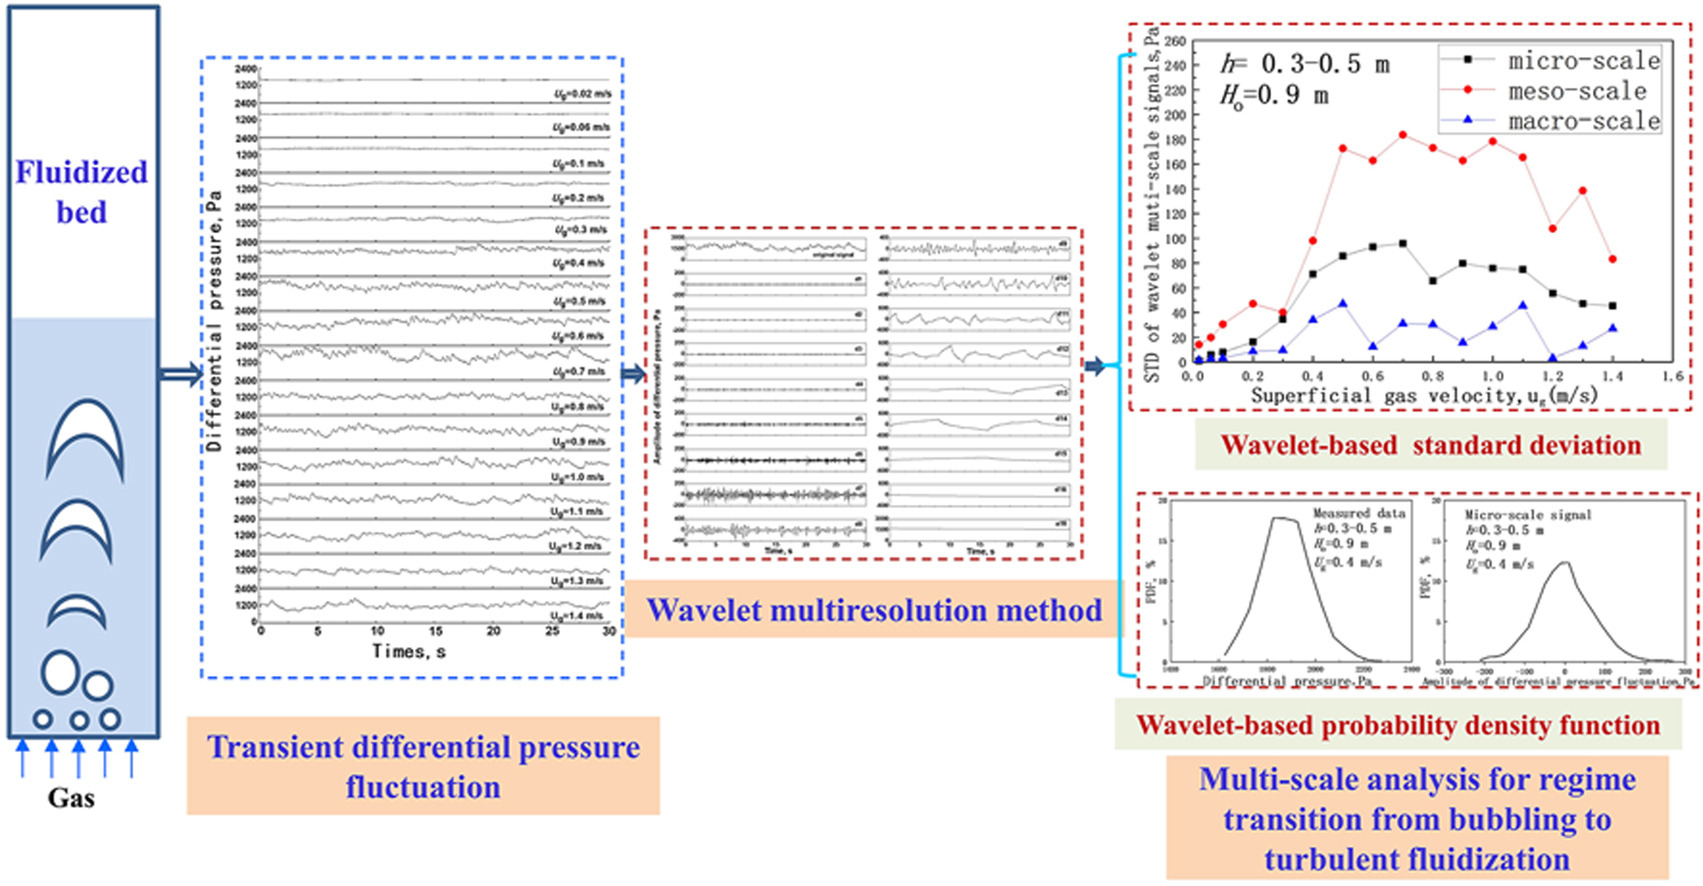
• A coupling data processing methodology was proposed for fluidization analysis.
• Studied multiscale hydrodynamics during bubbling-turbulent fluidization transition.
• Micro-scale signals majorly reflected the bubbling fluidization behavior.
• Meso-scale signals majorly highlighted the flow behavior of turbulent fluidization.
Gas-solid fluidized beds have found extensive utilization in frontline manufacturing, in particular as low-velocity beds. The fluidization status, the bubbling or turbulent flow regime and the transition in between, determine the system performance in practical applications. Though the convoluted hydrodynamics are quantitively evaluated through numerous data-processing methodologies, none of them alone can reflect all the critical information to identify the transition from the bubbling to the turbulent regime. Accordingly, this study was to exploit a coupling data processing methodology, in the combination of standard deviation, power spectrum density, probability density function, wavelet transform, and wavelet multiresolution method, to jointly explain the micro-flow structure at the regime transition from bubbling to turbulent fluidization. The transient differential pressure fluctuation was measured for the evaluation in a fluidized bed (0.267 m i.d. × 2.5 m height) with FCC catalysts ( ) at different superficial gas velocities (0.02–1.4 m/s). The results show that the onset of turbulent fluidization starts earlier in the top section of the bed than in the bottom section. The wavelet decomposition displays that the fluctuation of differential pressure mainly concentrates on the sub-signals with an intermediate frequency band. These sub-signals could be synthesized into three types of scales (micro-scale, meso-scale, and macro-scale), representing the multi-scale hydrodynamics in the fluidized bed. The micro-scale signal has the characteristic information of bubbling fluidization, and the characteristic information of turbulent fluidization is mainly represented by the meso-scale signal. This work provides a systematic comprehension of fluidization status assessment and serves as an impetus for more coupling analysis in this sector.

