期刊文章
过刊浏览
- Volumes 108-119 (2025)
-
Volumes 96-107 (2025)
-
Volume 107
Pages 1-376 (December 2025)
-
Volume 106
Pages 1-336 (November 2025)
-
Volume 105
Pages 1-356 (October 2025)
-
Volume 104
Pages 1-332 (September 2025)
-
Volume 103
Pages 1-314 (August 2025)
-
Volume 102
Pages 1-276 (July 2025)
-
Volume 101
Pages 1-166 (June 2025)
-
Volume 100
Pages 1-256 (May 2025)
-
Volume 99
Pages 1-242 (April 2025)
-
Volume 98
Pages 1-288 (March 2025)
-
Volume 97
Pages 1-256 (February 2025)
-
Volume 96
Pages 1-340 (January 2025)
-
Volume 107
-
Volumes 84-95 (2024)
-
Volume 95
Pages 1-392 (December 2024)
-
Volume 94
Pages 1-400 (November 2024)
-
Volume 93
Pages 1-376 (October 2024)
-
Volume 92
Pages 1-316 (September 2024)
-
Volume 91
Pages 1-378 (August 2024)
-
Volume 90
Pages 1-580 (July 2024)
-
Volume 89
Pages 1-278 (June 2024)
-
Volume 88
Pages 1-350 (May 2024)
-
Volume 87
Pages 1-338 (April 2024)
-
Volume 86
Pages 1-312 (March 2024)
-
Volume 85
Pages 1-334 (February 2024)
-
Volume 84
Pages 1-308 (January 2024)
-
Volume 95
-
Volumes 72-83 (2023)
-
Volume 83
Pages 1-258 (December 2023)
-
Volume 82
Pages 1-204 (November 2023)
-
Volume 81
Pages 1-188 (October 2023)
-
Volume 80
Pages 1-202 (September 2023)
-
Volume 79
Pages 1-172 (August 2023)
-
Volume 78
Pages 1-146 (July 2023)
-
Volume 77
Pages 1-152 (June 2023)
-
Volume 76
Pages 1-176 (May 2023)
-
Volume 75
Pages 1-228 (April 2023)
-
Volume 74
Pages 1-200 (March 2023)
-
Volume 73
Pages 1-138 (February 2023)
-
Volume 72
Pages 1-144 (January 2023)
-
Volume 83
-
Volumes 60-71 (2022)
-
Volume 71
Pages 1-108 (December 2022)
-
Volume 70
Pages 1-106 (November 2022)
-
Volume 69
Pages 1-122 (October 2022)
-
Volume 68
Pages 1-124 (September 2022)
-
Volume 67
Pages 1-102 (August 2022)
-
Volume 66
Pages 1-112 (July 2022)
-
Volume 65
Pages 1-138 (June 2022)
-
Volume 64
Pages 1-186 (May 2022)
-
Volume 63
Pages 1-124 (April 2022)
-
Volume 62
Pages 1-104 (March 2022)
-
Volume 61
Pages 1-120 (February 2022)
-
Volume 60
Pages 1-124 (January 2022)
-
Volume 71
- Volumes 54-59 (2021)
- Volumes 48-53 (2020)
- Volumes 42-47 (2019)
- Volumes 36-41 (2018)
- Volumes 30-35 (2017)
- Volumes 24-29 (2016)
- Volumes 18-23 (2015)
- Volumes 12-17 (2014)
- Volume 11 (2013)
- Volume 10 (2012)
- Volume 9 (2011)
- Volume 8 (2010)
- Volume 7 (2009)
- Volume 6 (2008)
- Volume 5 (2007)
- Volume 4 (2006)
- Volume 3 (2005)
- Volume 2 (2004)
- Volume 1 (2003)
Volume 106
Khakbiz, M., Shahmoradi, M. R., Akhlaghi, F., & Soroush, K. (2025). AI-enhanced support vector machine framework for nanoparticle size and surface nanotopography analysis. Particuology, 106, 156-173. https://doi.org/10.1016/j.partic.2025.07.017
AI-enhanced support vector machine framework for nanoparticle size and surface nanotopography analysis
Mehrdad Khakbiz a *, Mohammad R. Shahmoradi b, Farshad Akhlaghi c, Kimia Soroush d
a Department of Chemical and Biochemical Engineering, Rutgers, The State University of New Jersey, Piscataway, NJ, USA
b College of Interdisciplinary Science, University of Tehran, Tehran, Iran
c School of Metallurgy and Materials Engineering, College of Engineering, University of Tehran, Iran
d School of Electrical and Computer Engineering, Shiraz University, Shiraz, Iran
10.1016/j.partic.2025.07.017
Volume 106,
November 2025,
Pages 156-173
Received 6 May 2025, Revised 4 July 2025, Accepted 7 July 2025, Available online 28 July 2025, Version of Record 13 September 2025.
E-mail:
Mehrdad.Khakbiz@rutgers.edu
Highlights
• SVM models achieved R2 up to 0.99 for accurate particle size distribution prediction.
• SEM analysis revealed morphological transitions during Al-B4C powder milling.
• Surface roughness increased to 0.39 nm,analyzed using SPIP™ and GPR models.
• Mid-sized B4C particles showed optimal reduction with balanced milling times.
• Increasing B4C content to 10 % improved SVM accuracy in capturing milling dynamics.
Abstract
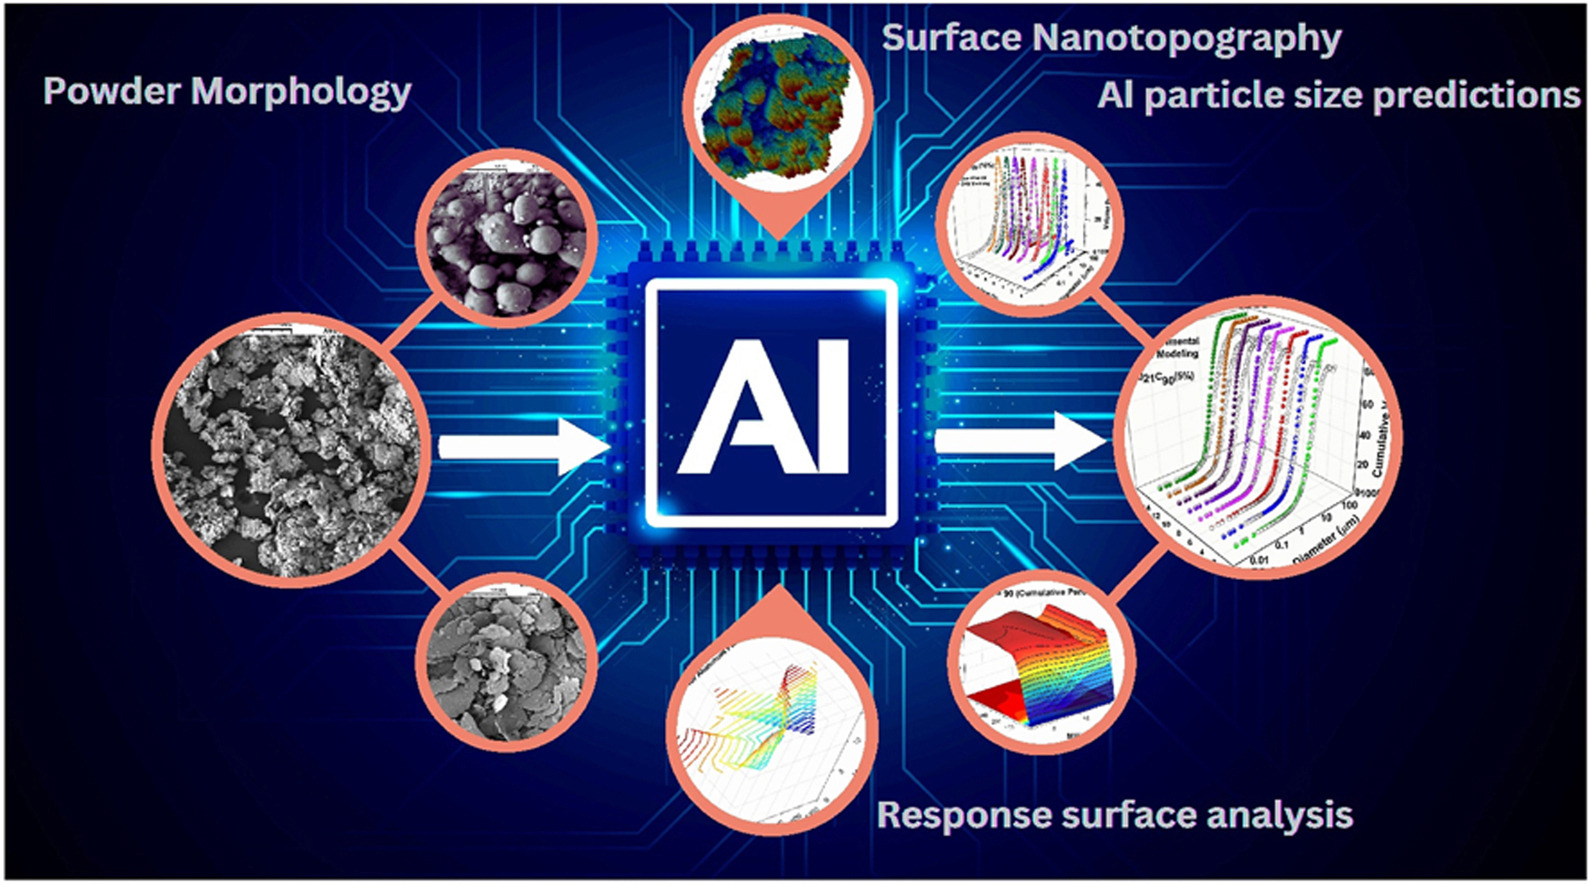
This study presents a machine learning-based approach using Support Vector Machines (SVM) to model the particle size distribution (PSD) and predict surface characteristics of Al-B4C nanocomposite powders synthesized through high-energy ball milling. Two SVM kernels, Polynomial and Radial Basis Function (RBF), were applied to simulate PSD curves and surface morphology, with experimental validation conducted via laser particle size analysis and scanning electron microscopy (SEM). The models demonstrated strong predictive capabilities, achieving R2 values between 0.91 and 0.99 and cross-validation coefficients (q2) from 0.93 to 0.99. Normal distribution models yielded lower RMSE values (0.11–2.13) compared to cumulative distribution models (4.34–6.55), indicating higher precision in modeling. SEM analysis revealed morphological transitions during milling, with particles evolving from spherical to fragmented shapes after 4 h. Surface metrics including roughness, waviness, and isotropy were quantified, showing that isotropy decreased from 82.48 % at 0 h to 57.69 % at 4 h due to directional deformation, then partially recovered to 62.50 % at 10 h. Gaussian Process Regression (GPR) showed strong alignment with experimental surface trends and accurately predicted nanoscale topographic parameters. Response Surface Methodology (RSM) was employed to visualize size reduction behavior for B4C particles with initial sizes of 90, 700, and 1200 nm. For 700 nm particles, size reduction stabilized beyond 10 h, while 90 nm particles exhibited rapid refinement within the first 5–10 h. In contrast, 1200 nm particles showed slower, continuous reduction requiring >15 h of milling. SVM models successfully captured these nonlinear trends,with minor underestimations at intermediate time points. RSM plots for aluminum particle sizes (21 and 71 μm) revealed that Al-21 led to stable and uniform distributions,whereas Al-71 exhibited nonlinear behavior with volume percentage drops under specific conditions. These findings confirm that SVM and GPR are robust tools for modeling PSD and surface evolution in ball-milled nanoparticles.
Graphical abstract
Keywords
Support vector machine (SVM); Particle size distribution curves; Kernels; Nanocomposites; Nanocrystalline; Gaussian process regression (GPR)
文章导读